
Reading time: 31m 56s
Most DeFi valuations borrow a TradFi trading multiple and apply it to protocol earnings, unadjusted for the risk taken or the dilution incurred to generate them.
We believe this is overly simplistic, circular, ignores risk and dilution, and it is where the market misprices this asset class.
Our valuation framework prices risk explicitly through the cost of equity (Ke: investor required return), built layer by layer from the equity risk premium, added with premia related to regulatory, governance, alignment of interest, and smart contract risk.
As such, we derive a framework to derive risk-adjusted returns for DeFi protocols.
Why is all this modeling and valuation work so relevant?
Institutional finance is merging onchain. Currently, a significant part of incremental capital has not yet been allocated.
We are moving from an industry that moves from speculative retail flows to institutional flows. Institutional flows are directed by sophisticated valuation models that forecast risk-adjusted returns.
After having built these models for leading TradFi banks and investment funds for over a decade, we are using the best practices derived from TradFi on the valuation of DeFi protocols.
We modeled three scenarios, bear, base, and bull, and maintained a probability weighted forecast (PW), which attached 20% probability to bear and bull forecasts and 60% to the base case forecast.
We also address the problem with comparable multiples and develop a better framework on how to correctly think about valuation multiples.
All of our valuation methods point in the same direction. In the current state, even after adjusting for risk and dilution (which we modeled explicitly using best practices from the equity market), the growth expectations are not sufficiently priced into the current c.$70 per token price, and we see attractive upside in a probability weighted scenario (PW) and significant upside in a bull scenario.
- Our DCF points to +68% probability-weighted upside (target price $118) and +301% upside in the bull scenario ($281 target price).
- The steady state PE multiple, calculated from the protocol's own economics at 9.8x base and 13.3x bull, says +60% and +241% PW and bull case upside potential, respectively ($112 and $239).
- The earnings yield says HYPE pays 4.8% on 2026 earnings, at parity with less risky TradFi comps, then compounds to 14.5% by 2030 (PW) while CME and Nasdaq sit near 6.6%. Even after accounting for the larger risk inherent in a DeFi platform, this earnings multiple screens very cheap.
We modeled three scenarios:
- The base case at 40% growth requires momentum continuity: the perp market keeps compounding, CEX/DEX ratio continues to migrate onchain, Hyperliquid holds its lead, and no enforcement action lands. Nothing in the base case requires a new mechanism, only the continuation of forces already observed.
- The bull case at 55% growth requires the Clarity Act to pass through Congress, institutional capital to arrive onchain at scale, and HIP-3 to diversify beyond a single builder.
- The bear case at 10% requires the moat to become ordinary: a well-capitalized entrant breaks the execution edge, DEX/CEX migration stalls, HIP-3 never graduates, and team capital discipline fails and dilutes the earnings growth with excessive token issuance. The bear needs four things to break at once, and even then, it grows at nearly double CME's mature rate.
Our valuation framework works in six steps, visualized and explained below, each with one takeaway.
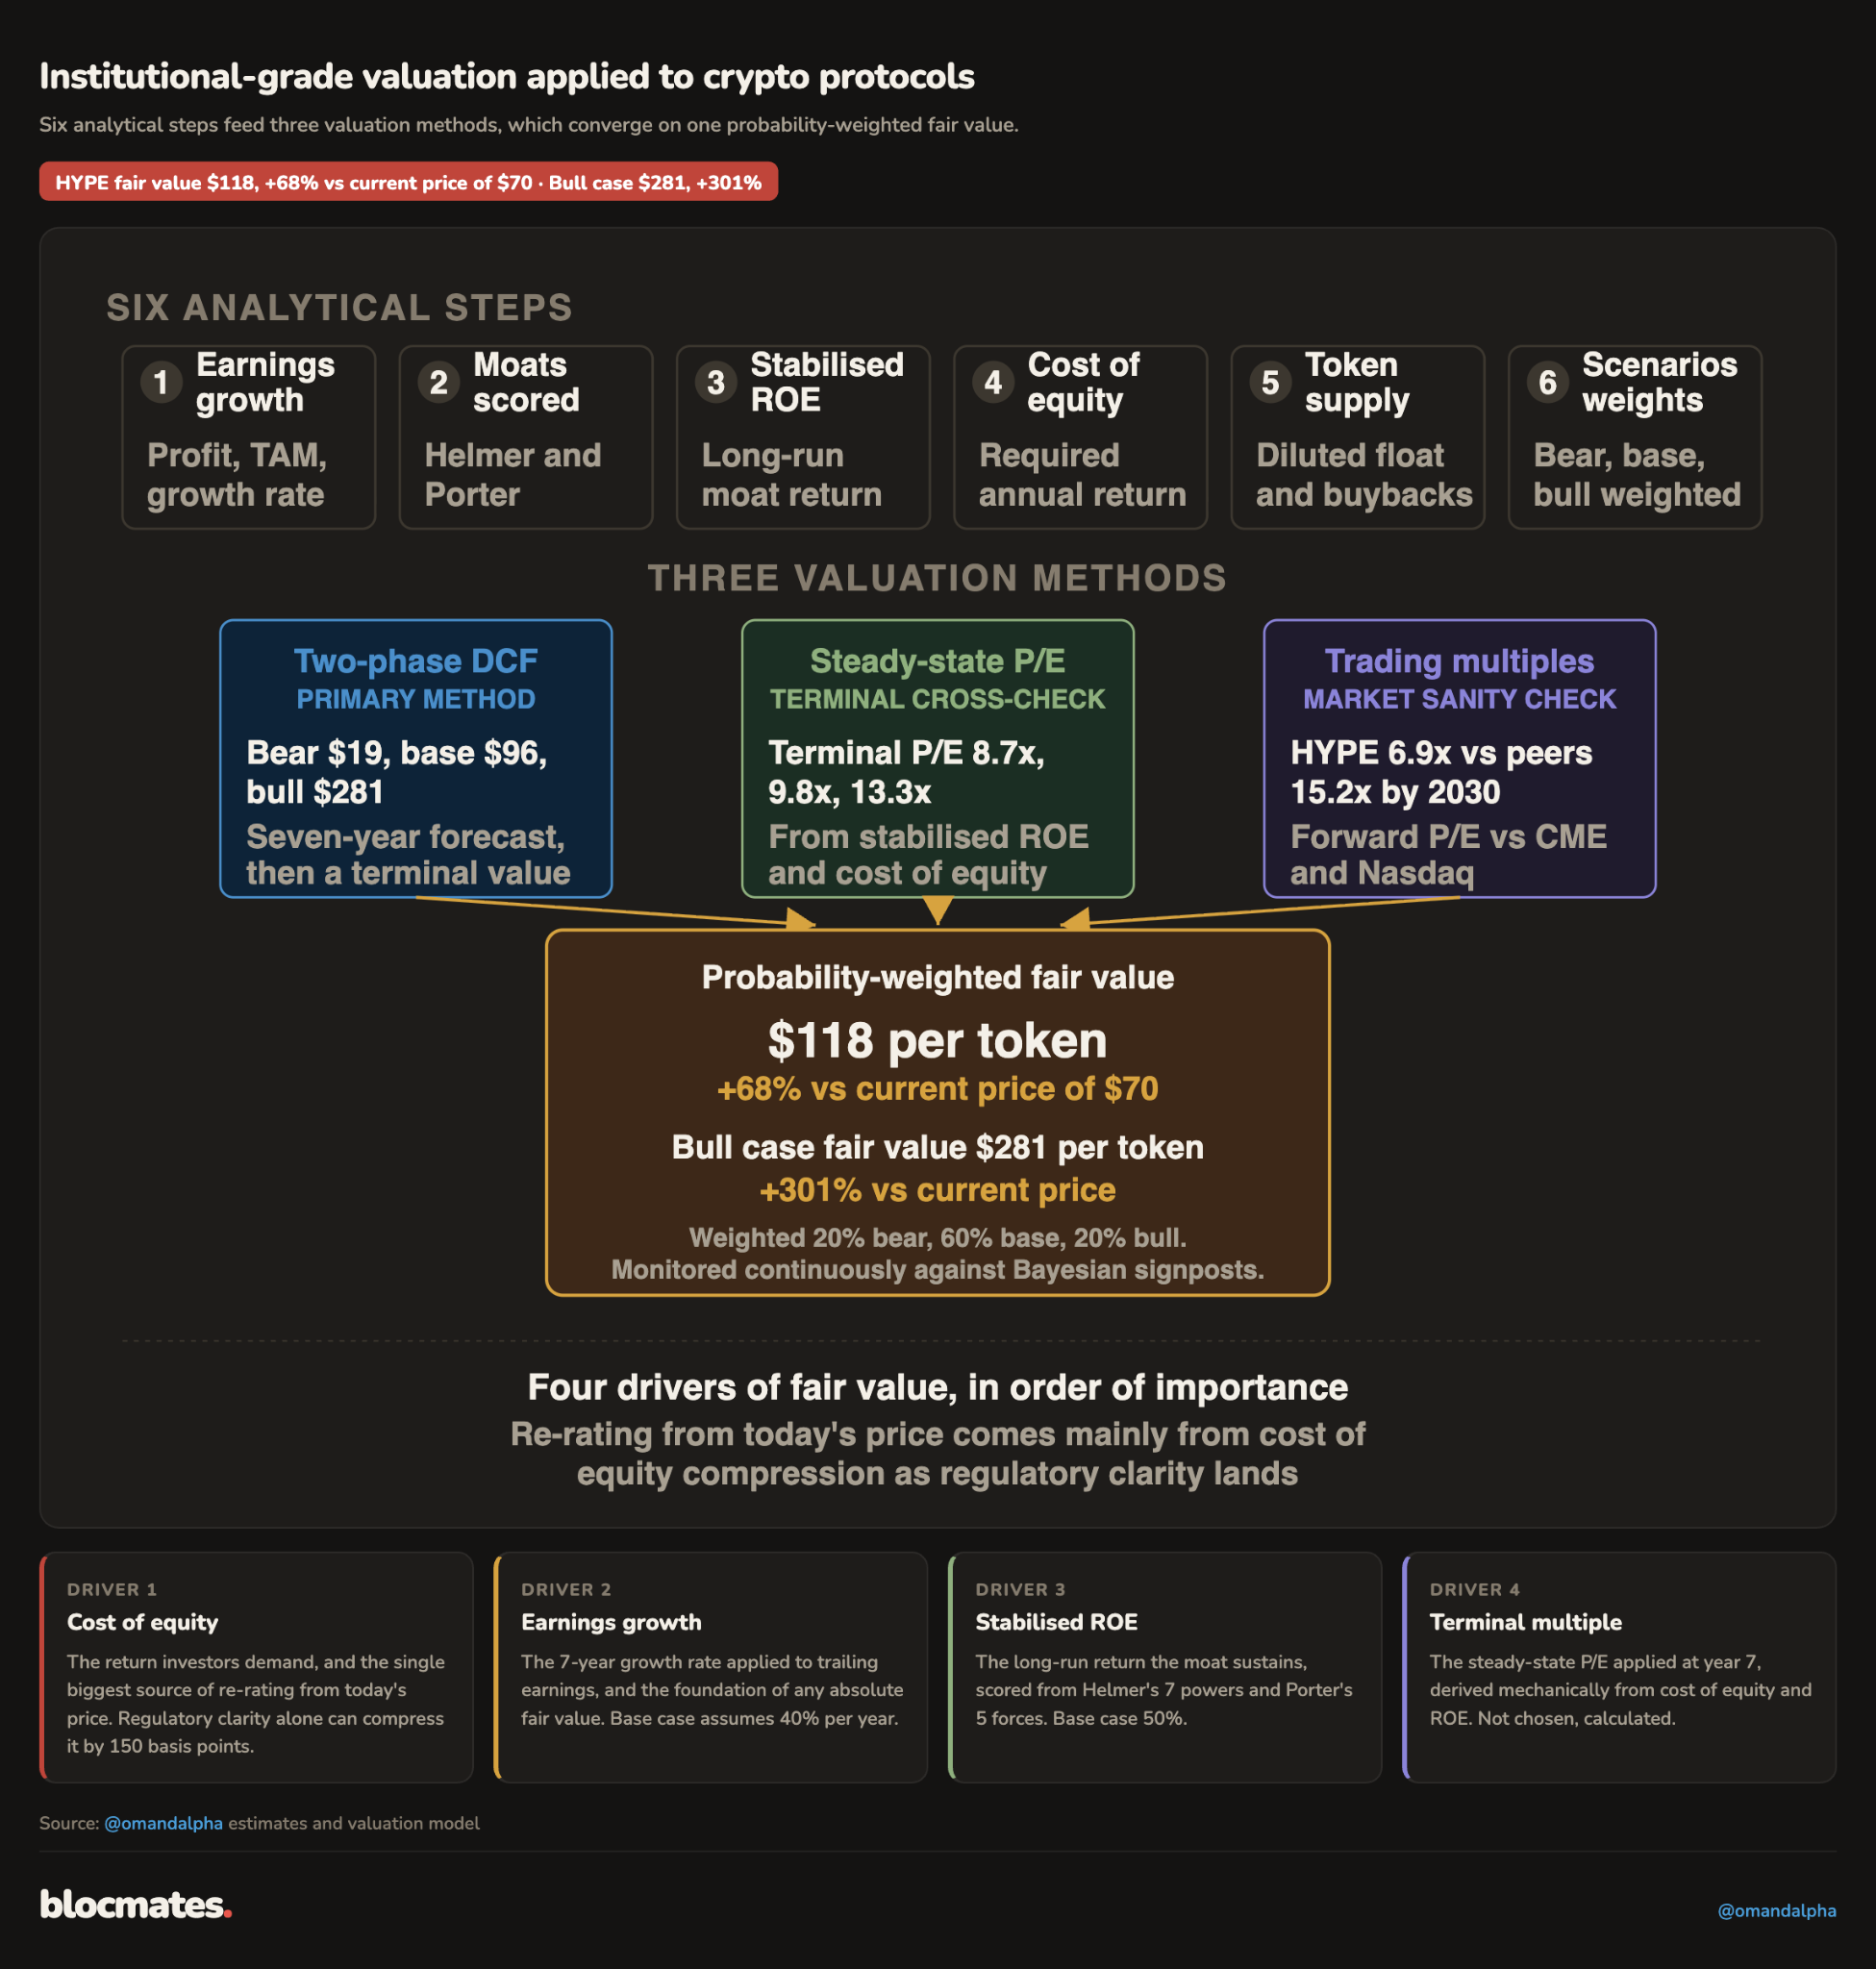
- Step 1: Clean earnings and growth forecast: Hyperliquid earns $1,074 million a year on a clean basis with near-zero emissions, and the compounding of three levers (market growth, DEX migration, market share) produces the 40% base case growth rate (55% in the bull case and 10% in the bear case). The earnings are honest, which is rare in this sector.
- Step 2: Moat scoring: Helmer and Porter scores land at a strong moat for Core Perps and near-monopoly for HIP-3. The moat is the entire justification for holding returns above the cost of capital.
- Step 3: Stabilized ROE: The current implied ROE near 190% is a hypergrowth phase return. We compress it to a stable state of 50% base and 70% bull before valuing a single terminal dollar, and that number drives the terminal multiple.
- Step 4: Cost of equity: Built layer by layer to 13.7% base against roughly 8% for CME. This is the dominant lever in the valuation and the largest source of re-rating from today's price. We benchmark the required return with what is observed in the equity markets, which have time-tested and validated these rates.
- Step 5: Supply and buybacks modeling: Every vested token counts, claimed or not, giving a terminal count of 456 million in the base case against the 222 million circulating figure that flatters headline multiples. Diluted EPS still grows 6x over seven years in spite of that.
- Step 6: Valuation scenarios and probabilities: Weighted 20/60/20, the three fair values of $19, $96, and $281 blend to $118 (PW).
Our valuation table summary
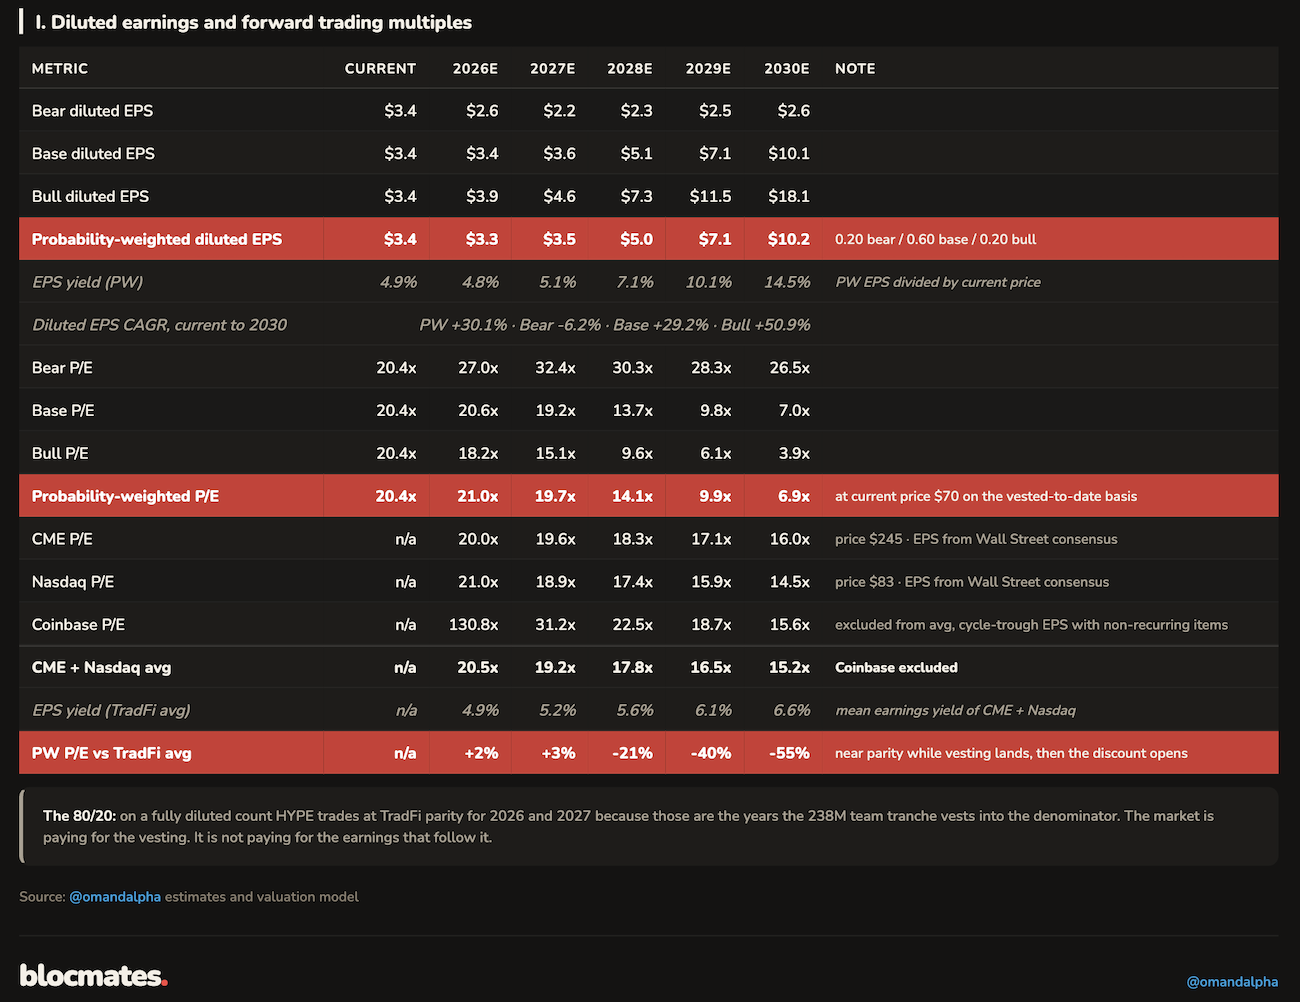
We see diluted EPS CAGR of 30% in a PW scenario and 51% in a bull scenario. That is an impressive growth even after accounting for full dilution of every token that is vested.
This steep growth results in a PW EPS yield c.15% by 2030. This is comparable to the junk bond yield of many distressed companies and nations, and hence, points to undervaluation.
While we are not fans of comparable PE multiples (multiples borrowed from less risky peers) and prefer stabilized PE multiples (which are calculated from the protocol’s own economics), we still calculated them.
Peer multiples are calculated from Wall Street consensus EPS forecasts, and here, undervaluation seems clear.
Currently, HYPE trades inline with TradFi peers, but due to the aggressive EPS growth, we expect its PE to be at a 55% discount to peers by 2030.
As we will point out, this fully ignores the concept of risk-adjusted returns.
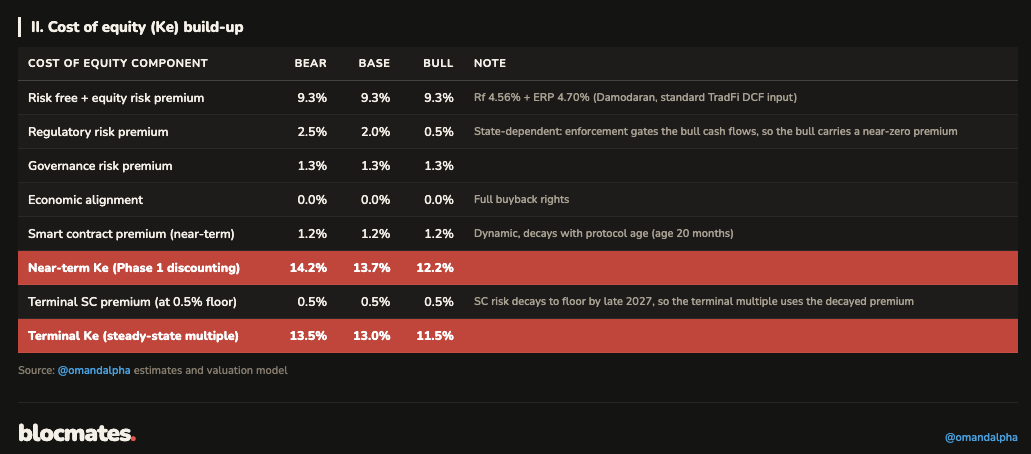
The calculation of the required return is a major topic that makes this analysis stand out from the crowd, which generally derives multiples from ‘the street,’ ignoring both risk and dilution.
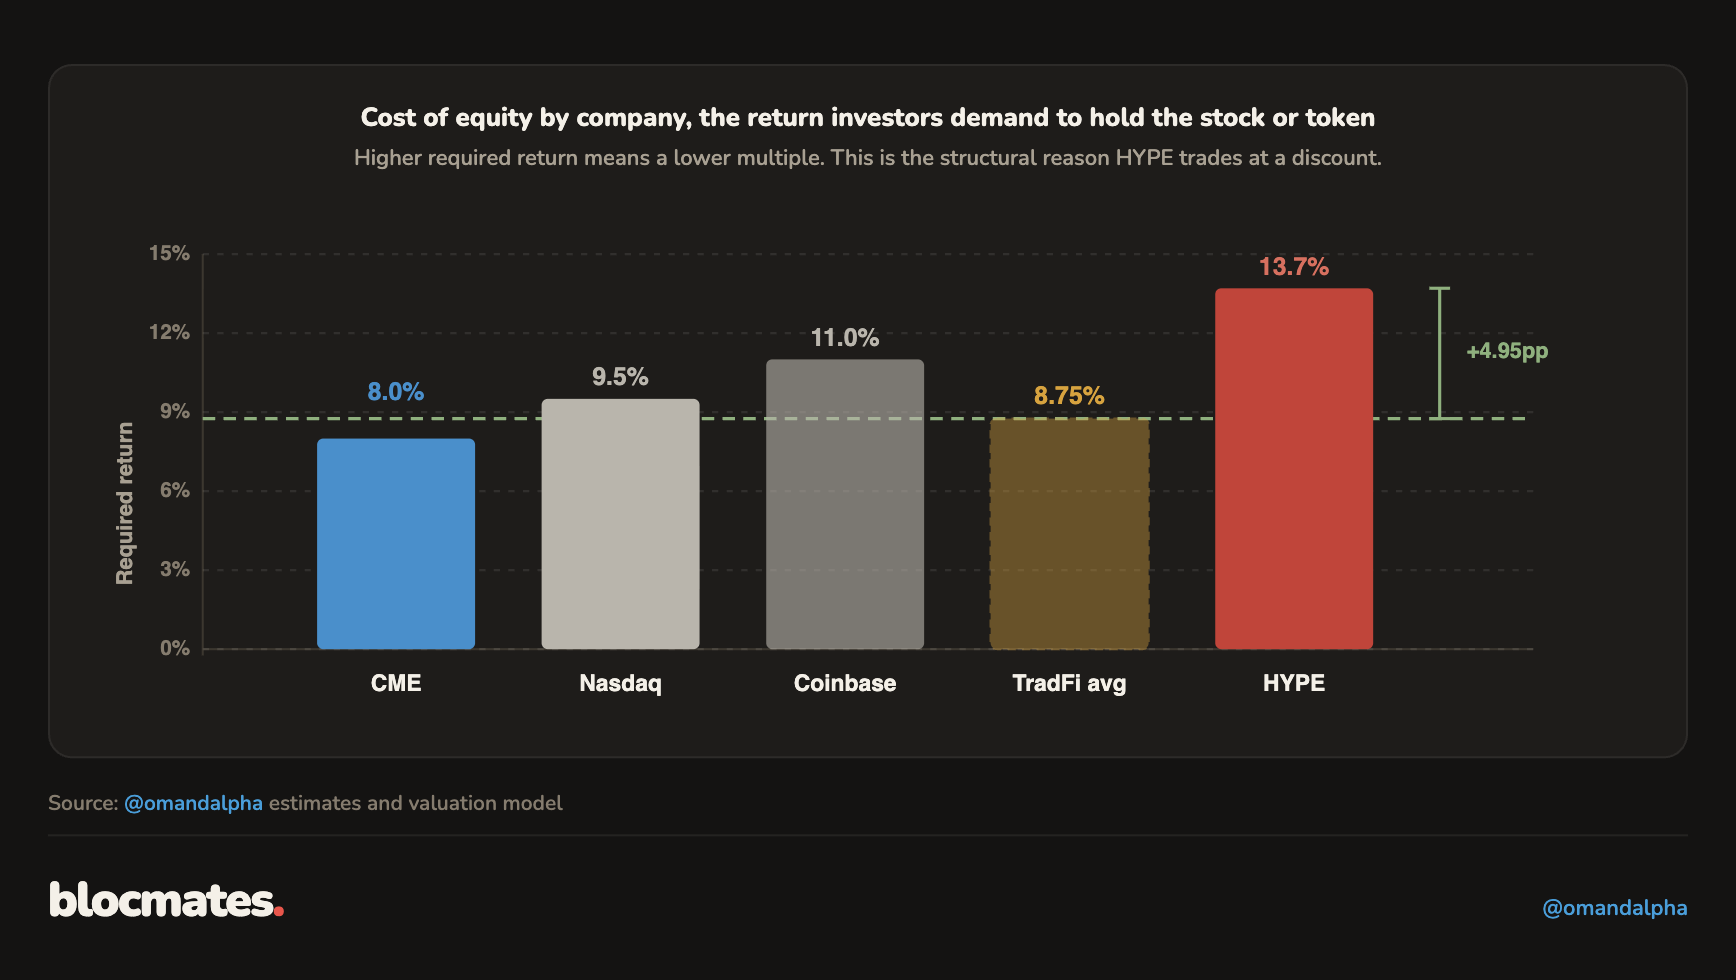
We apply a bottom-up framework for the calculation of the required return and derive a base case hurdle rate of 13.7% (bull: 12.2%).
HYPE stands out from other DeFi protocols as it has 0% risk premium, in addition to economic alignment. This is thanks to the full participation of the token in the earnings model and thanks to the absence of conflict of interest related to an equity structure or VC structure that takes the economic benefit at the expense of token holders.
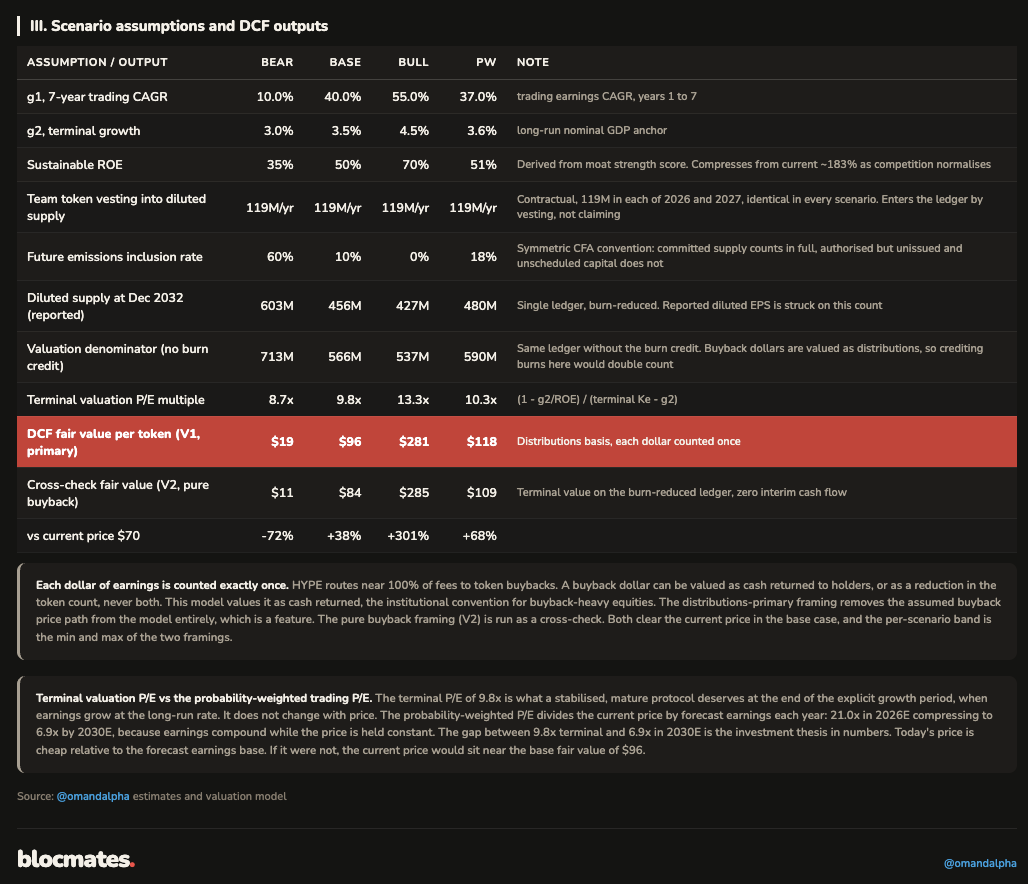
Our DCF valuation and Terminal Valuation PE multiple are the outputs of our six-step valuation framework. Both methods point to decent undervaluation in a PW scenario and substantial undervaluation in a bull scenario.
This is even after accounting for full dilution of the Core Contributor tokens and after adjusting the aggressive earnings growth for the risk that is taken to generate these returns.
Our PW and bull scenario target prices come out at $118 and $281 per token, and we performed sensitivity analyses for different growth rates and required returns.
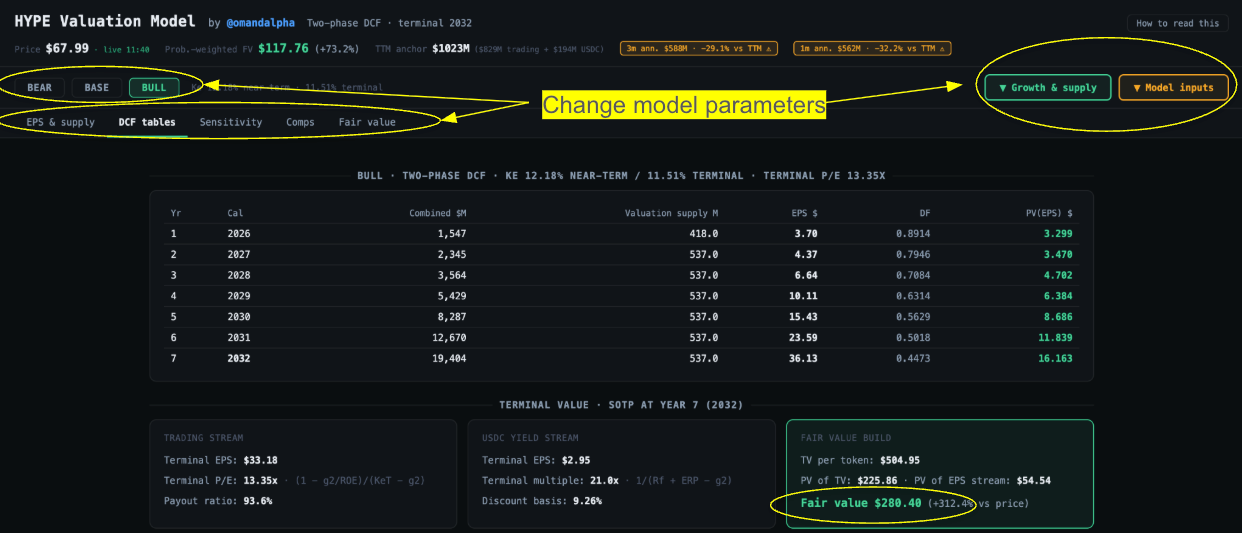
Our interactive valuation model is live
Some people may have different views on our assumptions on growth, dilution, or risk. This is why we made an interactive valuation model, which allows users to play with the inputs and see the sensitivity of inputs on target prices.
Check out our interactive valuation model here.
Step 1: Market size, clean earnings, and growth assumptions
Every serious valuation model starts with clean, ‘top-line,’ segmented earnings, to which a forecast market growth and market share estimate is applied.
Analysts clean up earnings by adjusting observed numbers for non-recurring or one-off items, incentives (generally used to push up revenue), and expenses.
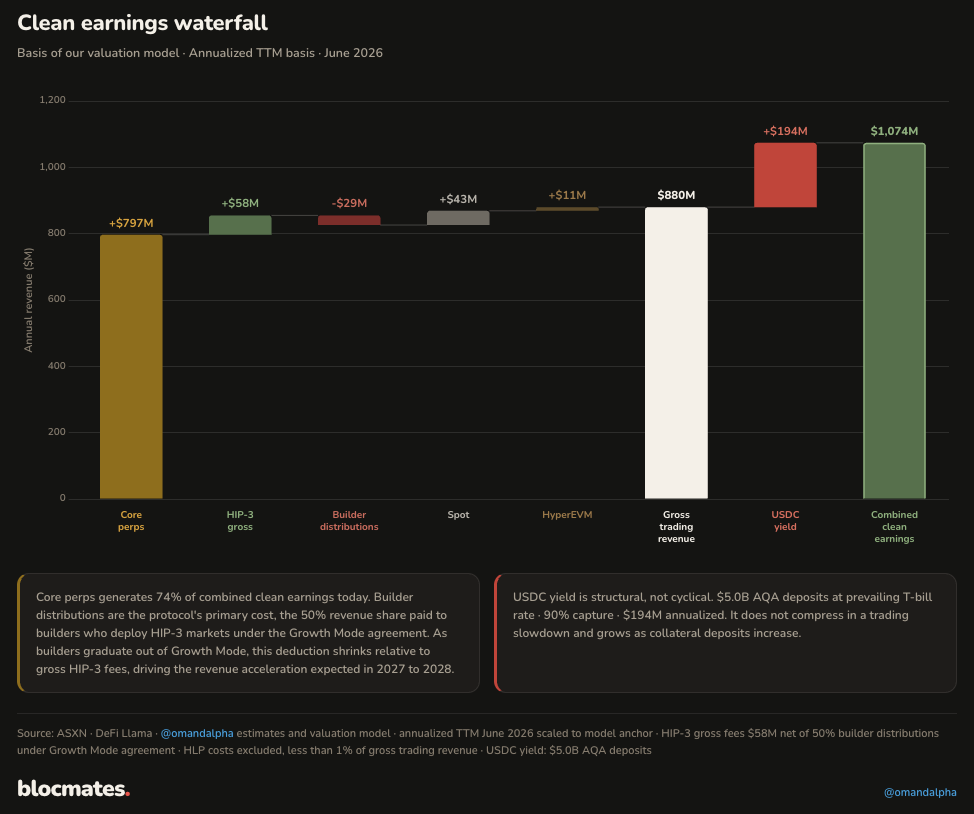
Today, Hyperliquid earns $1,074 million a year on a clean basis: $880 million in trailing twelve-month (TTM) trading earnings plus $194 million in USDC yield. Every valuation output in this report is built on that number.
Clean means gross fees minus everything that does not belong to token holders, as shown in the clean earnings waterfall below: core perps contribute $797 million, HIP-3 adds $58 million net of builder distributions, spot and HyperEVM add $54 million combined.
Token emissions are near zero, and that line separates Hyperliquid from most of the sector. USDC yield is earned on $5 billion of collateral at prevailing T-bill rates, and set to grow along with our perp volume growth rates, which we underwrite in our model.
The three growth levers
Forward earnings are driven by three levers. Each operates independently, and the global perp market volume chart shows all three stacked: total perp market growth, the CEX-to-DEX migration, and Hyperliquid's market share of total DEX volume.
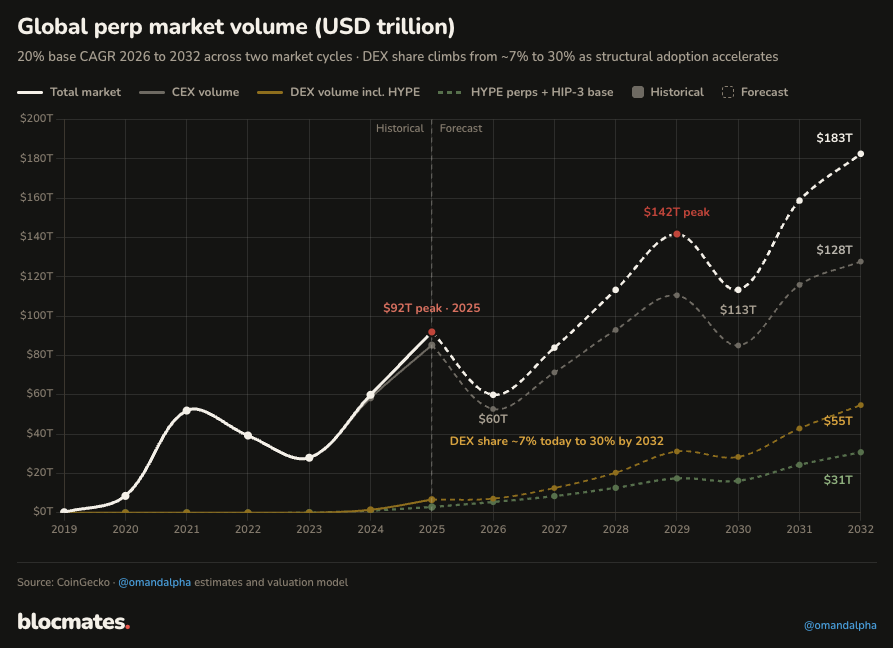
- Market growth: Global perpetuals volume peaked at $92 trillion in 2025, up from $8.6 trillion in 2020, a 61% five-year CAGR. That hypergrowth phase is over. We underwrite a 20% forward market CAGR through 2032 in the base case and 30% in the bull, against 10% in the bear. Even the base case is a third of the trailing rate, supported by regulated access expanding the addressable base: Kalshi has CFTC approval, and Coinbase is launching domestic perps.
- DEX share of the total perp market: Volume is migrating onchain, from zero five years ago to roughly 7% today. We expect DEX penetration to continue: centralized exchanges face escalating KYC and custody obligations in every major jurisdiction, while non-custodial venues carry none of that overhead for non-US users. We underwrite DEX share reaching 30% by 2032 in the base case and 35% or above in the bull.
- Hyperliquid's share of DEX volume: HYPE holds roughly 40% of DEX perp volume today, and the Lighter incentive campaign end-2025 showed that HYPE’s market share is ‘reasonably’ robust: whilst mercenary capital exists, the aggressive incentives could not structurally hit or dethrone HYPE’s leading market share. We underwrite Hyperliquid's market share growing to 50% by 2032 in the base case and 60% in the bull.
Three scenarios: bear, base, and bull
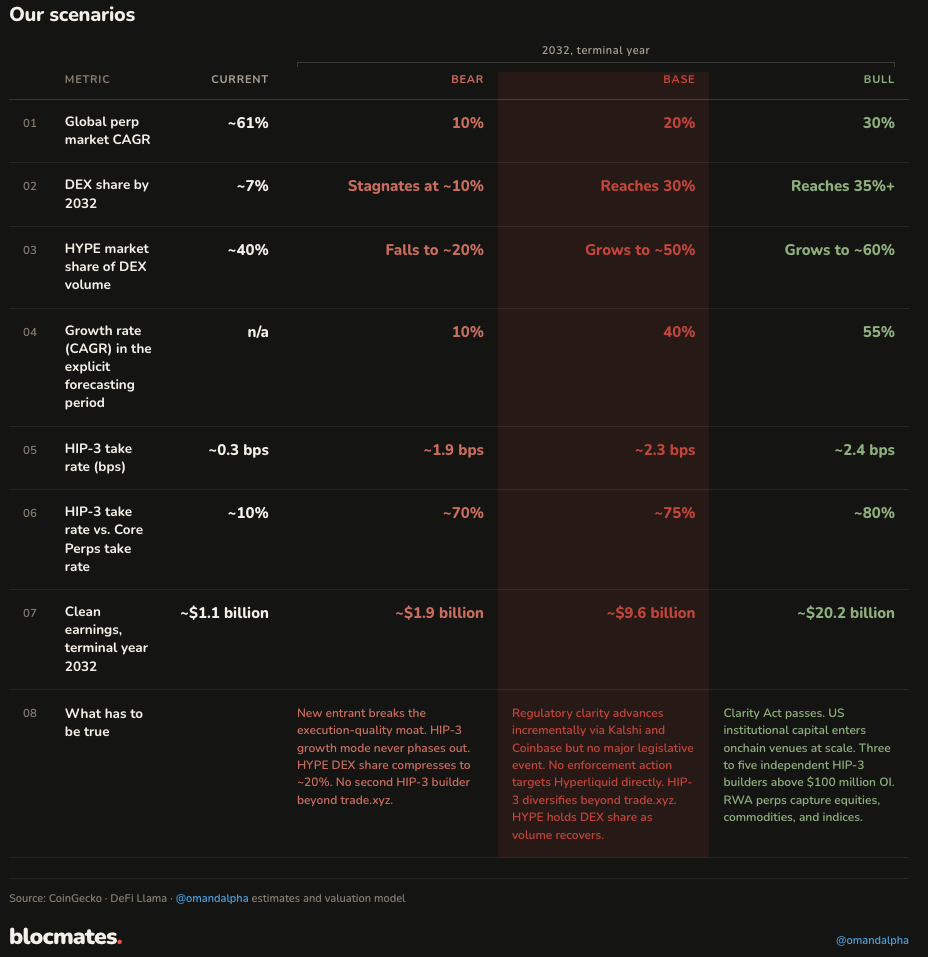
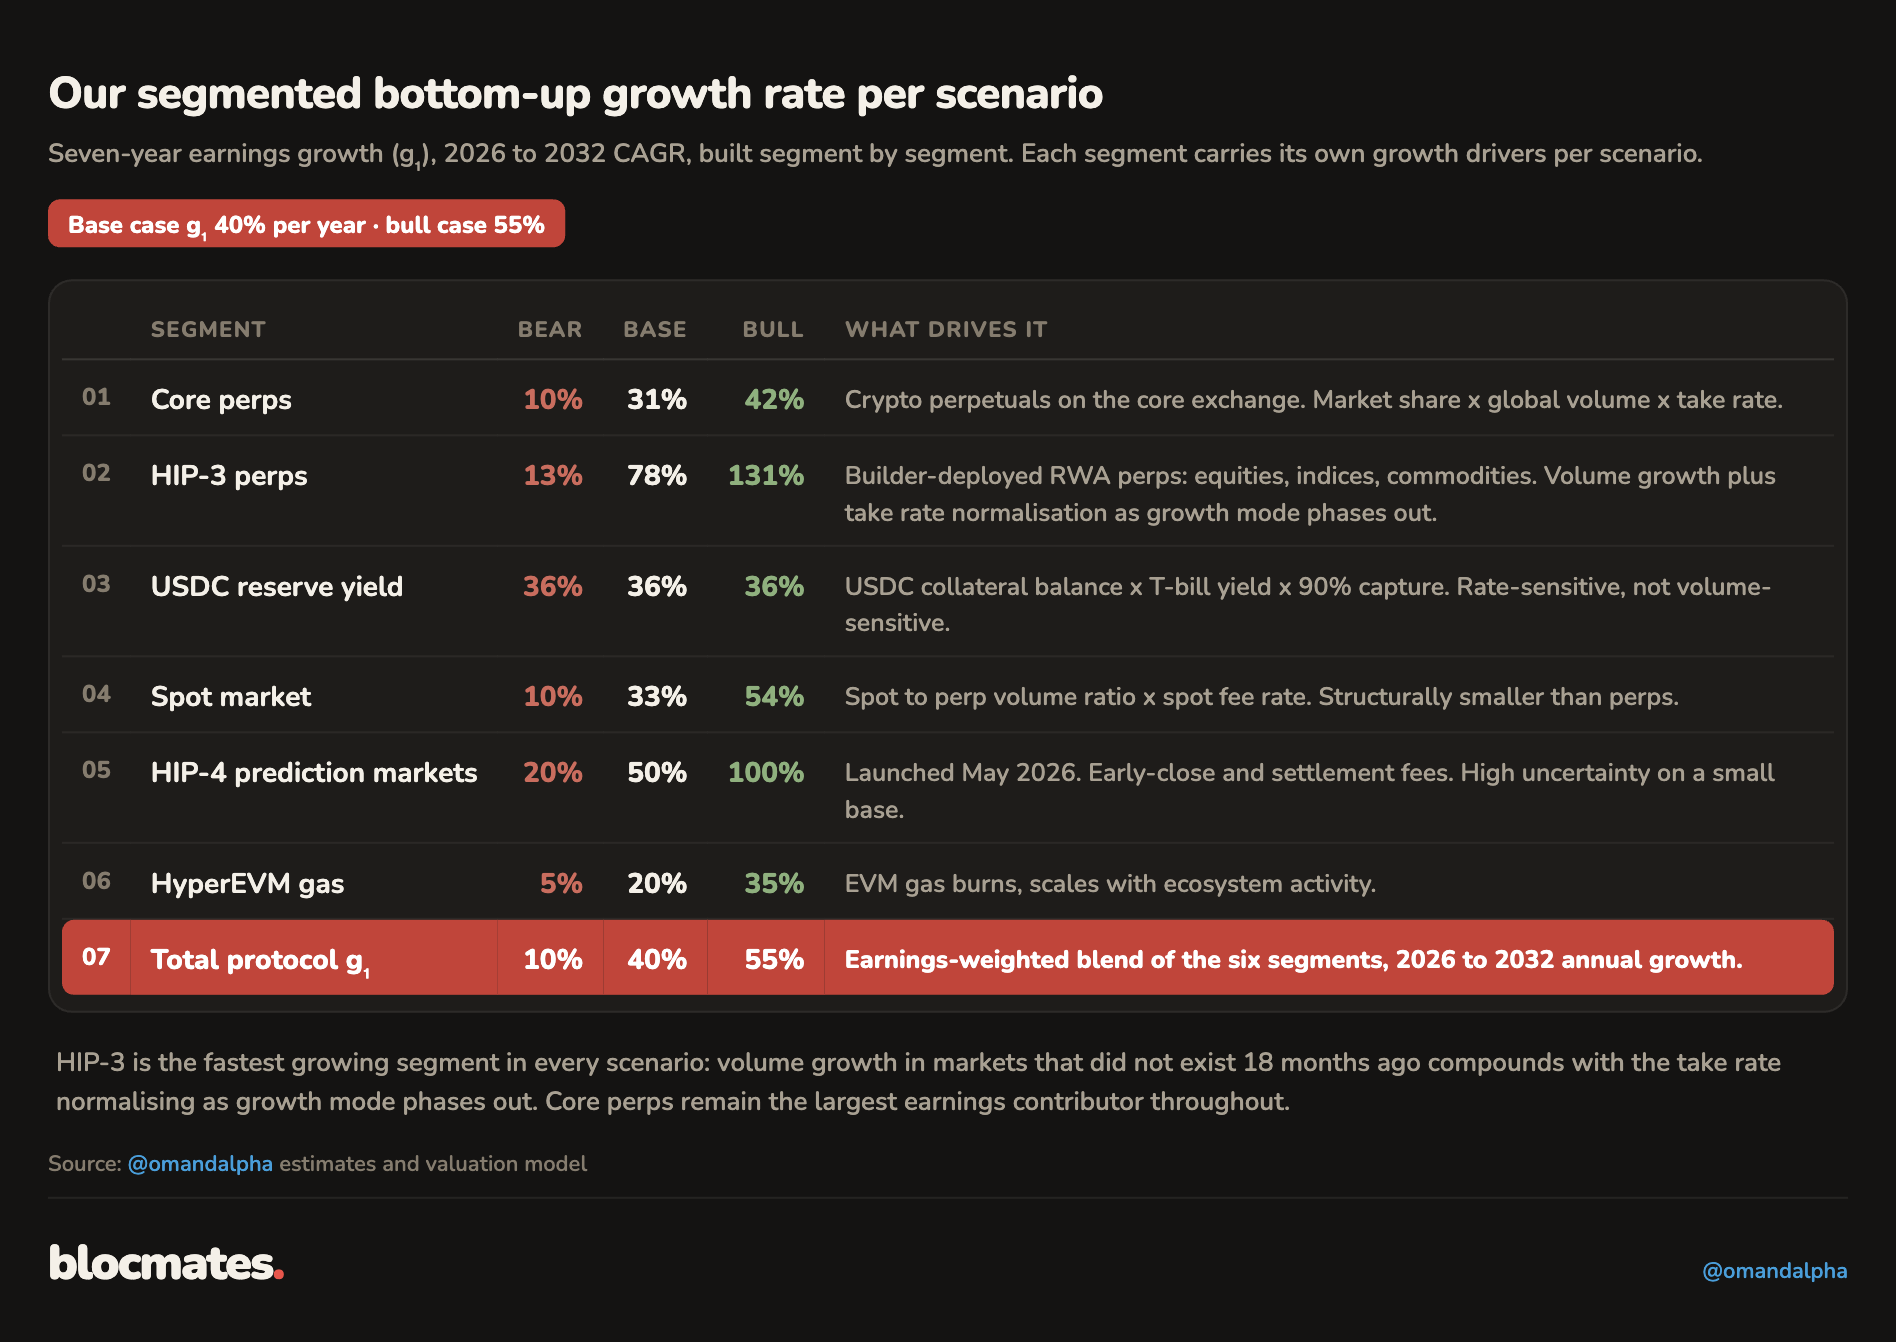
The scenario table sets out the full assumption stack per scenario, and the compounding of the three levers is what produces g₁, the seven-year trading earnings CAGR that we include in our explicit earnings forecast: 40% base, 55% bull, 10% bear.
By the 2032 terminal year, clean earnings reach $9.6 billion in the base case and $20.2 billion in the bull, against $1.9 billion in the bear.
Throughout the report, a probability-weighted (PW) scenario is given, in which we give 20% importance to bear and bull estimates and 60% to our base case.
We calculated what the break-even growth rate is that would equate our base case growth rate to today’s token price of about $70, keeping all our base case modeling assumptions flat. This growth rate equals 34% per year. Our base case sits just above that (g1 base= 40%).
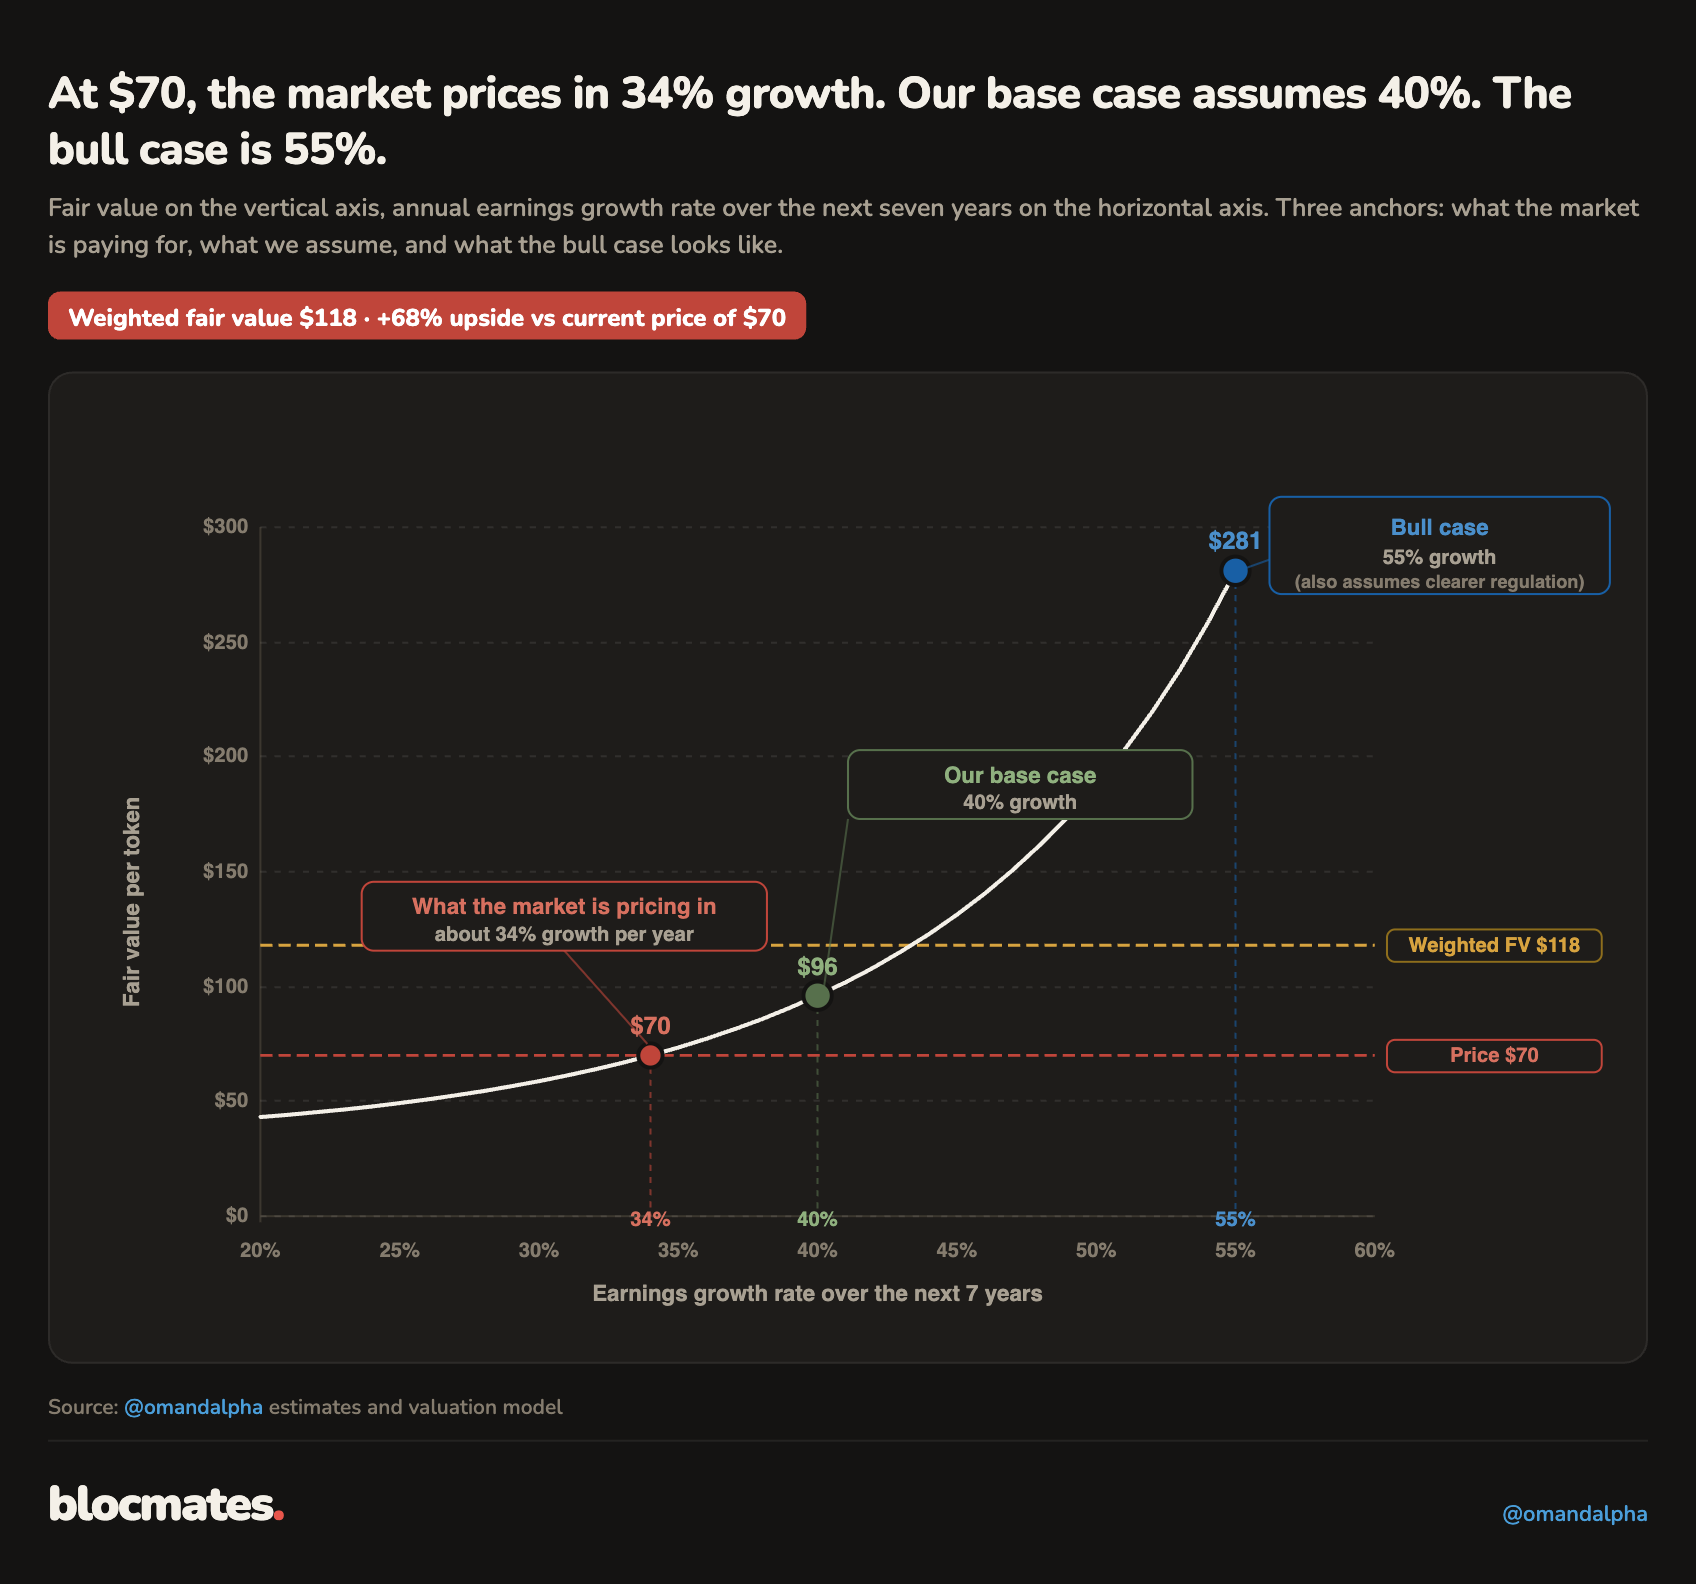
The base case essentially requires the three growth levers to continue in momentum (market size, DEX market share and HYPE market share continue growing), with no regulatory deterioration (no major enforcement action).
The bull case at 55% requires the Clarity Act to pass, institutional capital to enter on-chain venues at scale, and RWA perps to establish onchain as the primary venue for 24/7 commodity and index trading.
The bear case at 10% requires a well-capitalized competitor to break the execution moat and DEX share to stagnate, and even then, it runs at nearly double CME's 5-9% mature-exchange rate growth.
Breaking down the growth rate in the explicit earnings forecast horizon on a segmented basis below.
HIP-3, the growth mode, and the difficulty of scaling beyond a single deployer
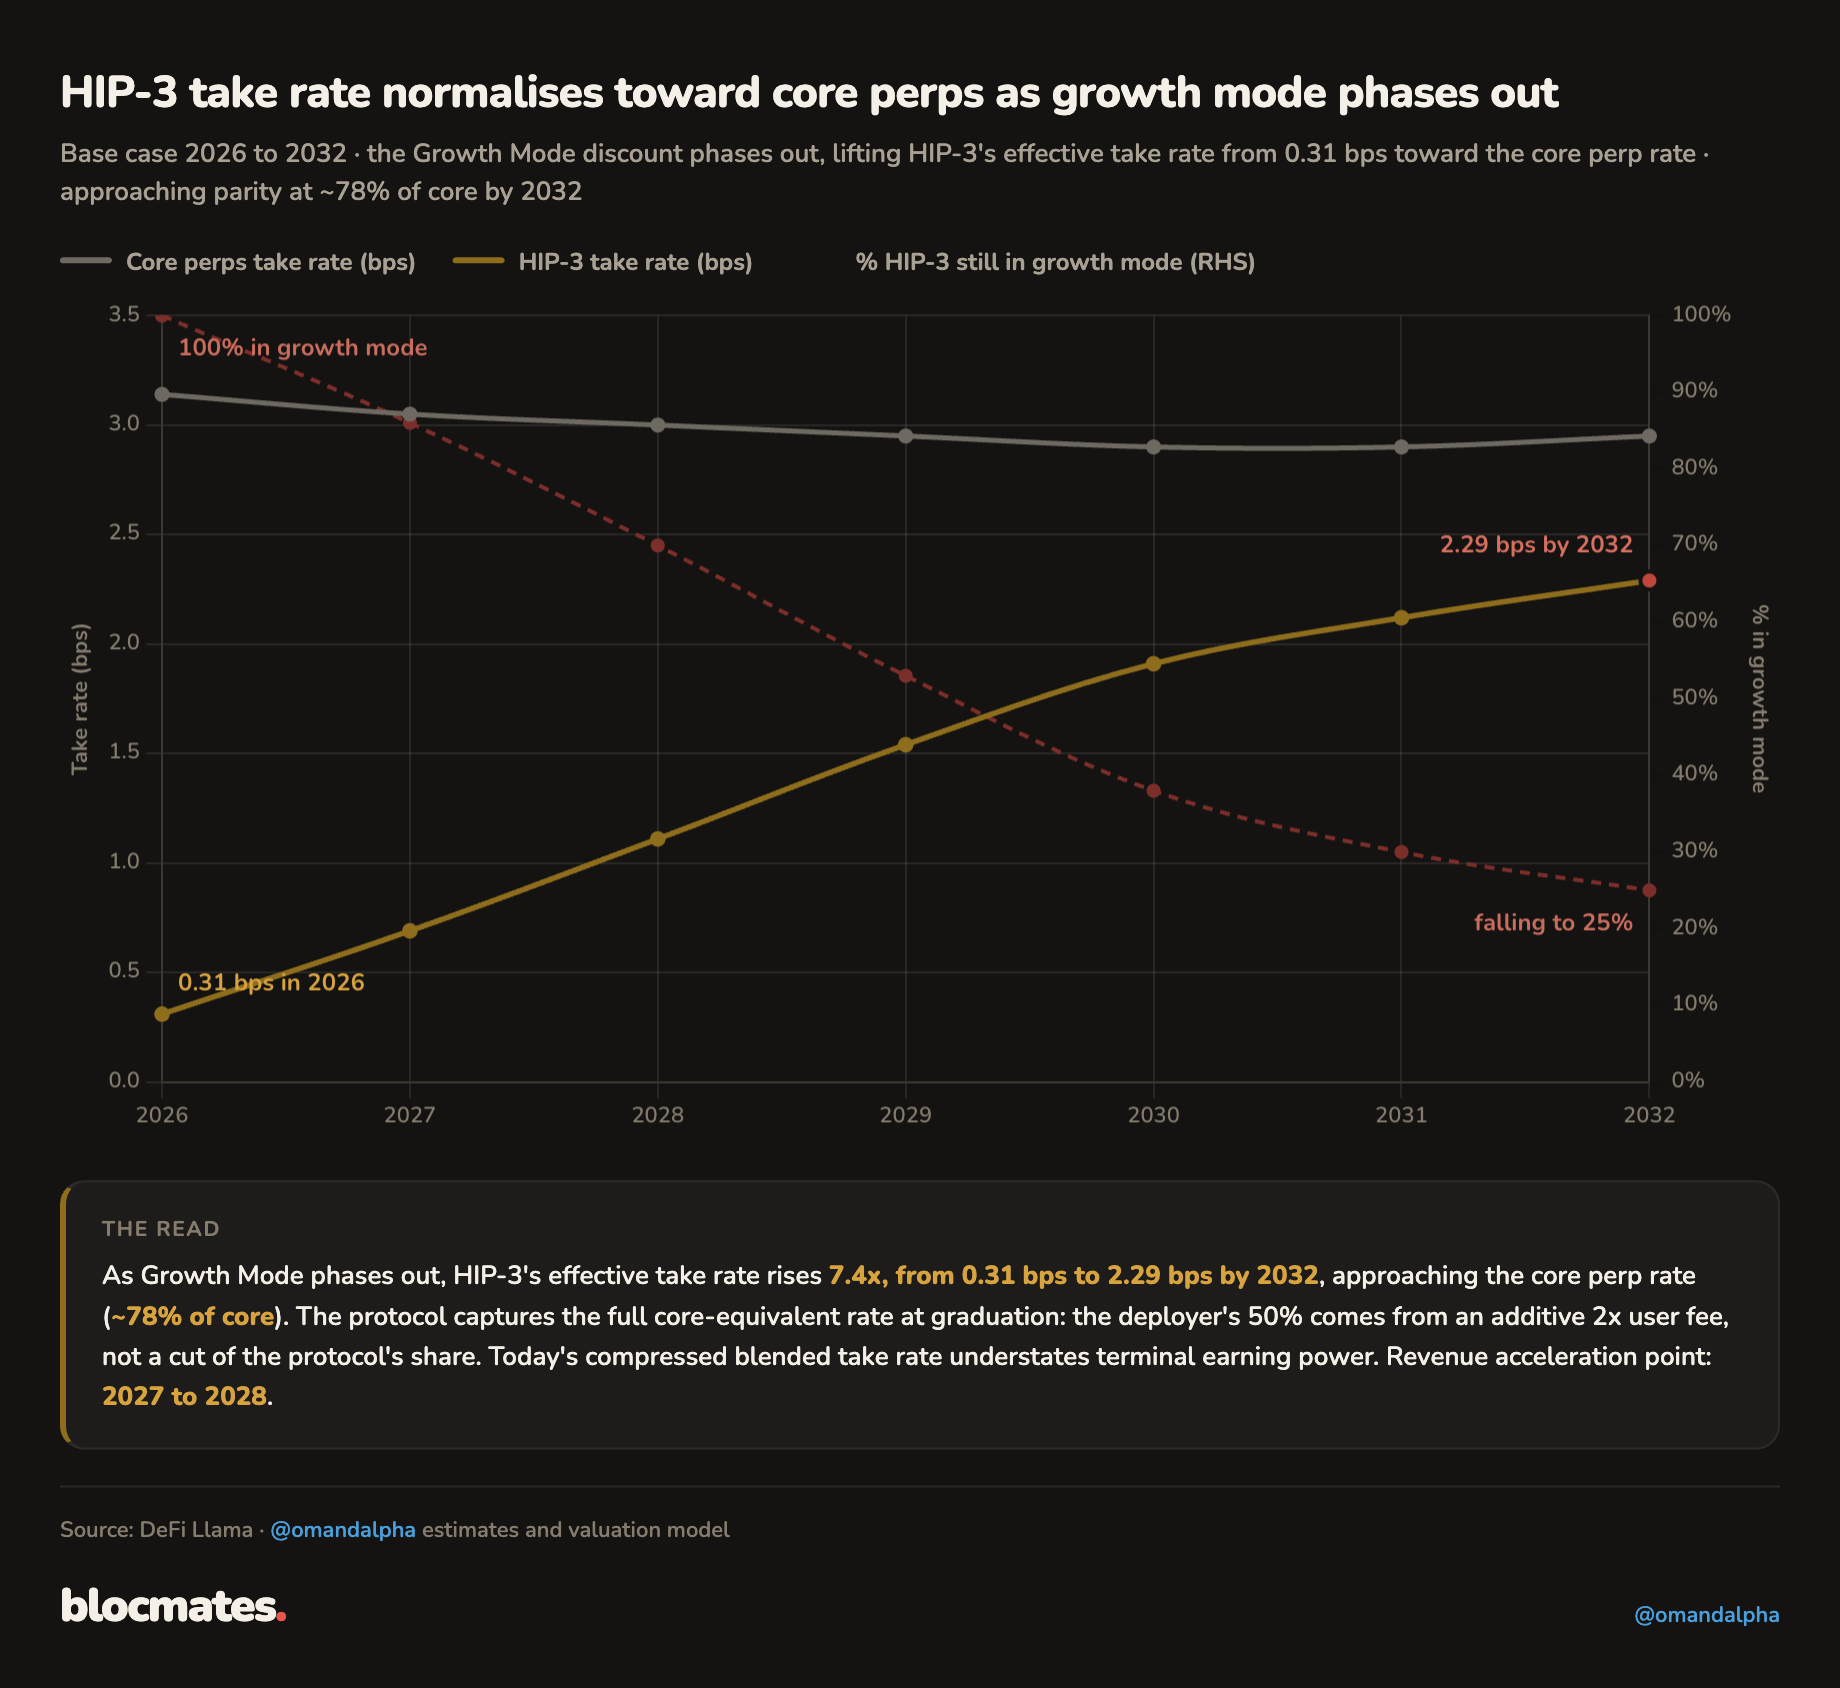
After the USDC deal, HIP-3 is the newest segment and the most sophisticated one to model. This is due to the growth mode, which enables deployers to cut the fees to 10% of the traditional core perp fees in order to bootstrap liquidity in new markets.
Graduation enables the deployer to gradually increase fees towards core perps as liquidity picks up.
In 2026, the effective HIP-3 take rate sits at 0.31 bps with 100% of volume in growth mode, roughly a tenth of the core perp rate.
As markets graduate to standard rates, the blended take rate rises by 2032 to 2.3 bps in the base case and 2.4 bps in the bull, reaching 75% and 80% of the core rate, respectively.
The revenue acceleration in HIP-3 lands in 2027 to 2028, when the first major markets exit growth mode on our assumptions.
That 7x improvement in revenue per dollar of volume generates $1.2 billion in base case HIP-3 revenue by 2032, or 11% of clean earnings in the base and 14% in the bull.
Note that graduation is voluntary and sits with the deployer. Today's compressed rate understates terminal earning power, and the model is more sensitive to graduation timing than to volume growth.
Growth mode and a strong HYPE price prevent scaling of HIP-3 volume beyond a single deployer.
The deployer economics table below shows why the current structure is a problem for attracting new deployers. Currently, most of the volume in HIP-3 is concentrated in one deployer, TradeXYZ.
Every new deployer needs to commit a single 500K HYPE bond covering all its markets, and the relevant benchmark is the 2.4% validator staking yield that same capital earns doing nothing.
TradeXYZ currently dominates about 95% of the volume in HIP-3, a position it can defend thanks to entering in October 2025 at roughly $10 per HYPE, a real commitment of nearly $5 million.
Currently, it earns roughly $30 million a year against this deposit, which is a c.600% annualized return.
These attractive economics contrast with what a new deployer needs to commit today: $35 million for identical structural economics (500K HYPE at c.$70 per token).
This capital commitment can be compared with the minimum hurdle that needs to be cleared, notably the c.2.4% validator staking yield.
In order to clear this hurdle in a low take-rate environment (growth mode activated), a new deployer must generate a volume of $18 billion a month, or $1.8 billion a month in standard mode (standard Core perp take rates), just to clear the opportunity cost of clearing the validator hurdle rate.
This is more than what any deployer other than TradeXYZ currently generates in HIP-3.
On top of that, right now it costs about $35K to list a new ticker, which has to be recouped while in growth mode (lower trading fees), all while TradeXYZ could copy-paste your market if it sees it doing well (has happened before).
We have also seen HIP-3 deployer teams shut down already (Ventuals, Felix, and Dreamcash).
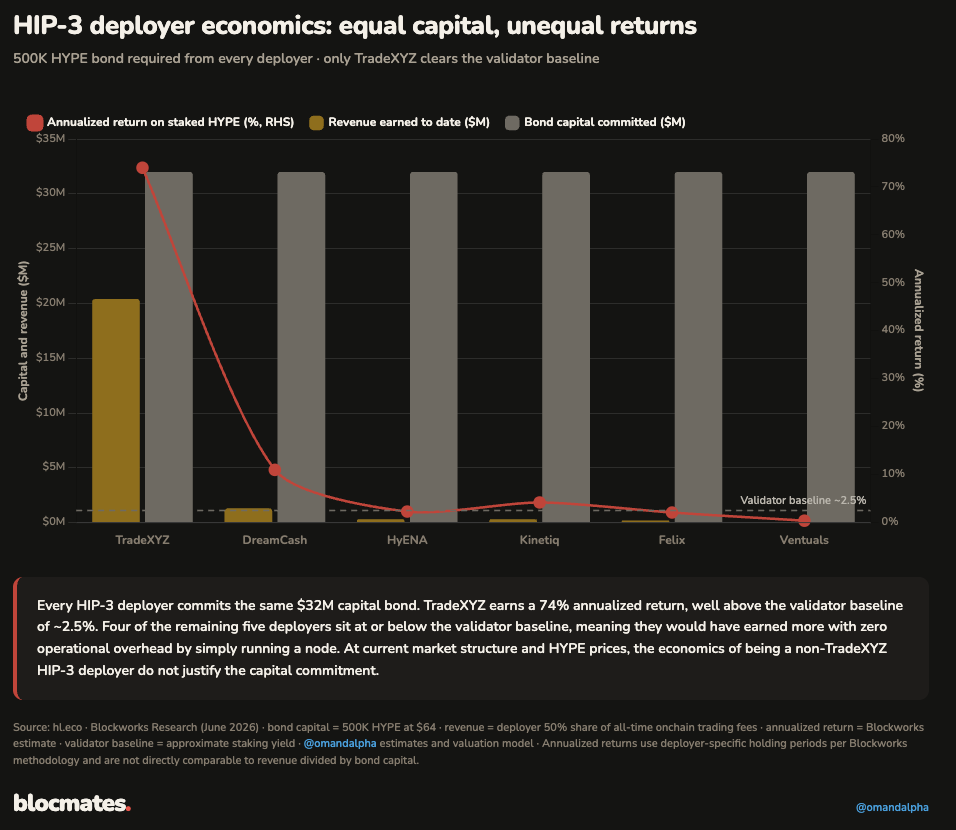
In conclusion, the more HYPE’s price appreciates at an unchanged deployer level economics (i.e., unchanged 500K HYPE bond), the harder it becomes for new deployers to launch new markets in HIP-3 and the more dependent this segment becomes on one single deployer, creating a vulnerability to profitable growth.
Our bull case scenario requires the attraction of more deployers independent of TradeXYZ, but this becomes harder as HYPE appreciates.
Hyperliquid can mitigate this in three ways.
Firstly, tiered bond requirements by market risk class. Today, the bond for a new operator is 500k HYPE, irrespective of the risk of the underlying market it intends to list.
This bond could be scaled down for liquid, blue-chip markets and kept for illiquid, exotic markets.
Second, temporary fee routing for pre-breakeven markets. Part of the protocol fee could be rerouted back to the developer until it reaches break-even (as measured, for example, by the opportunity cost: the foregone staking yield on the bond).
Third, liquid staking infrastructure for the bond. Currently, the bond earns nothing. Allowing the deployer to stake its bond enables it to earn yield and completely clears the hurdle rate from day one.
Note that none of these measures are part of the official roadmap but can help mitigate the dependency on a single deployer, lower risk related to the HIP-3 segment, and improve the overall risk/reward profile of the protocol, and hence, the valuation.
Step 2: Moat strength and stabilized ROE
After the assessment of the overall market and protocol growth rates, our valuation framework moves towards the scoring of the moat and the determination of what can be a fair stabilized return on equity (ROE) in bear, base, and bull scenarios.
A stabilized ROE must be distinguished from a current observed ROE, which runs into c.190% as is calculated as the recurring earnings (c.$1,074m) divided by the equity base (Assistance Fund of c.$561m; this is the protocol-controlled equity and not TVL).
Three forces drive the current observed ROE to a stabilized, steady state ROE:
- Competition impacts market share
- Possible regulatory capital requirements, boosting the equity base
- Possible treasury accumulation
Stabilized ROE describes what an investor can earn on his share in the equity once the hypergrowth phase has ended.
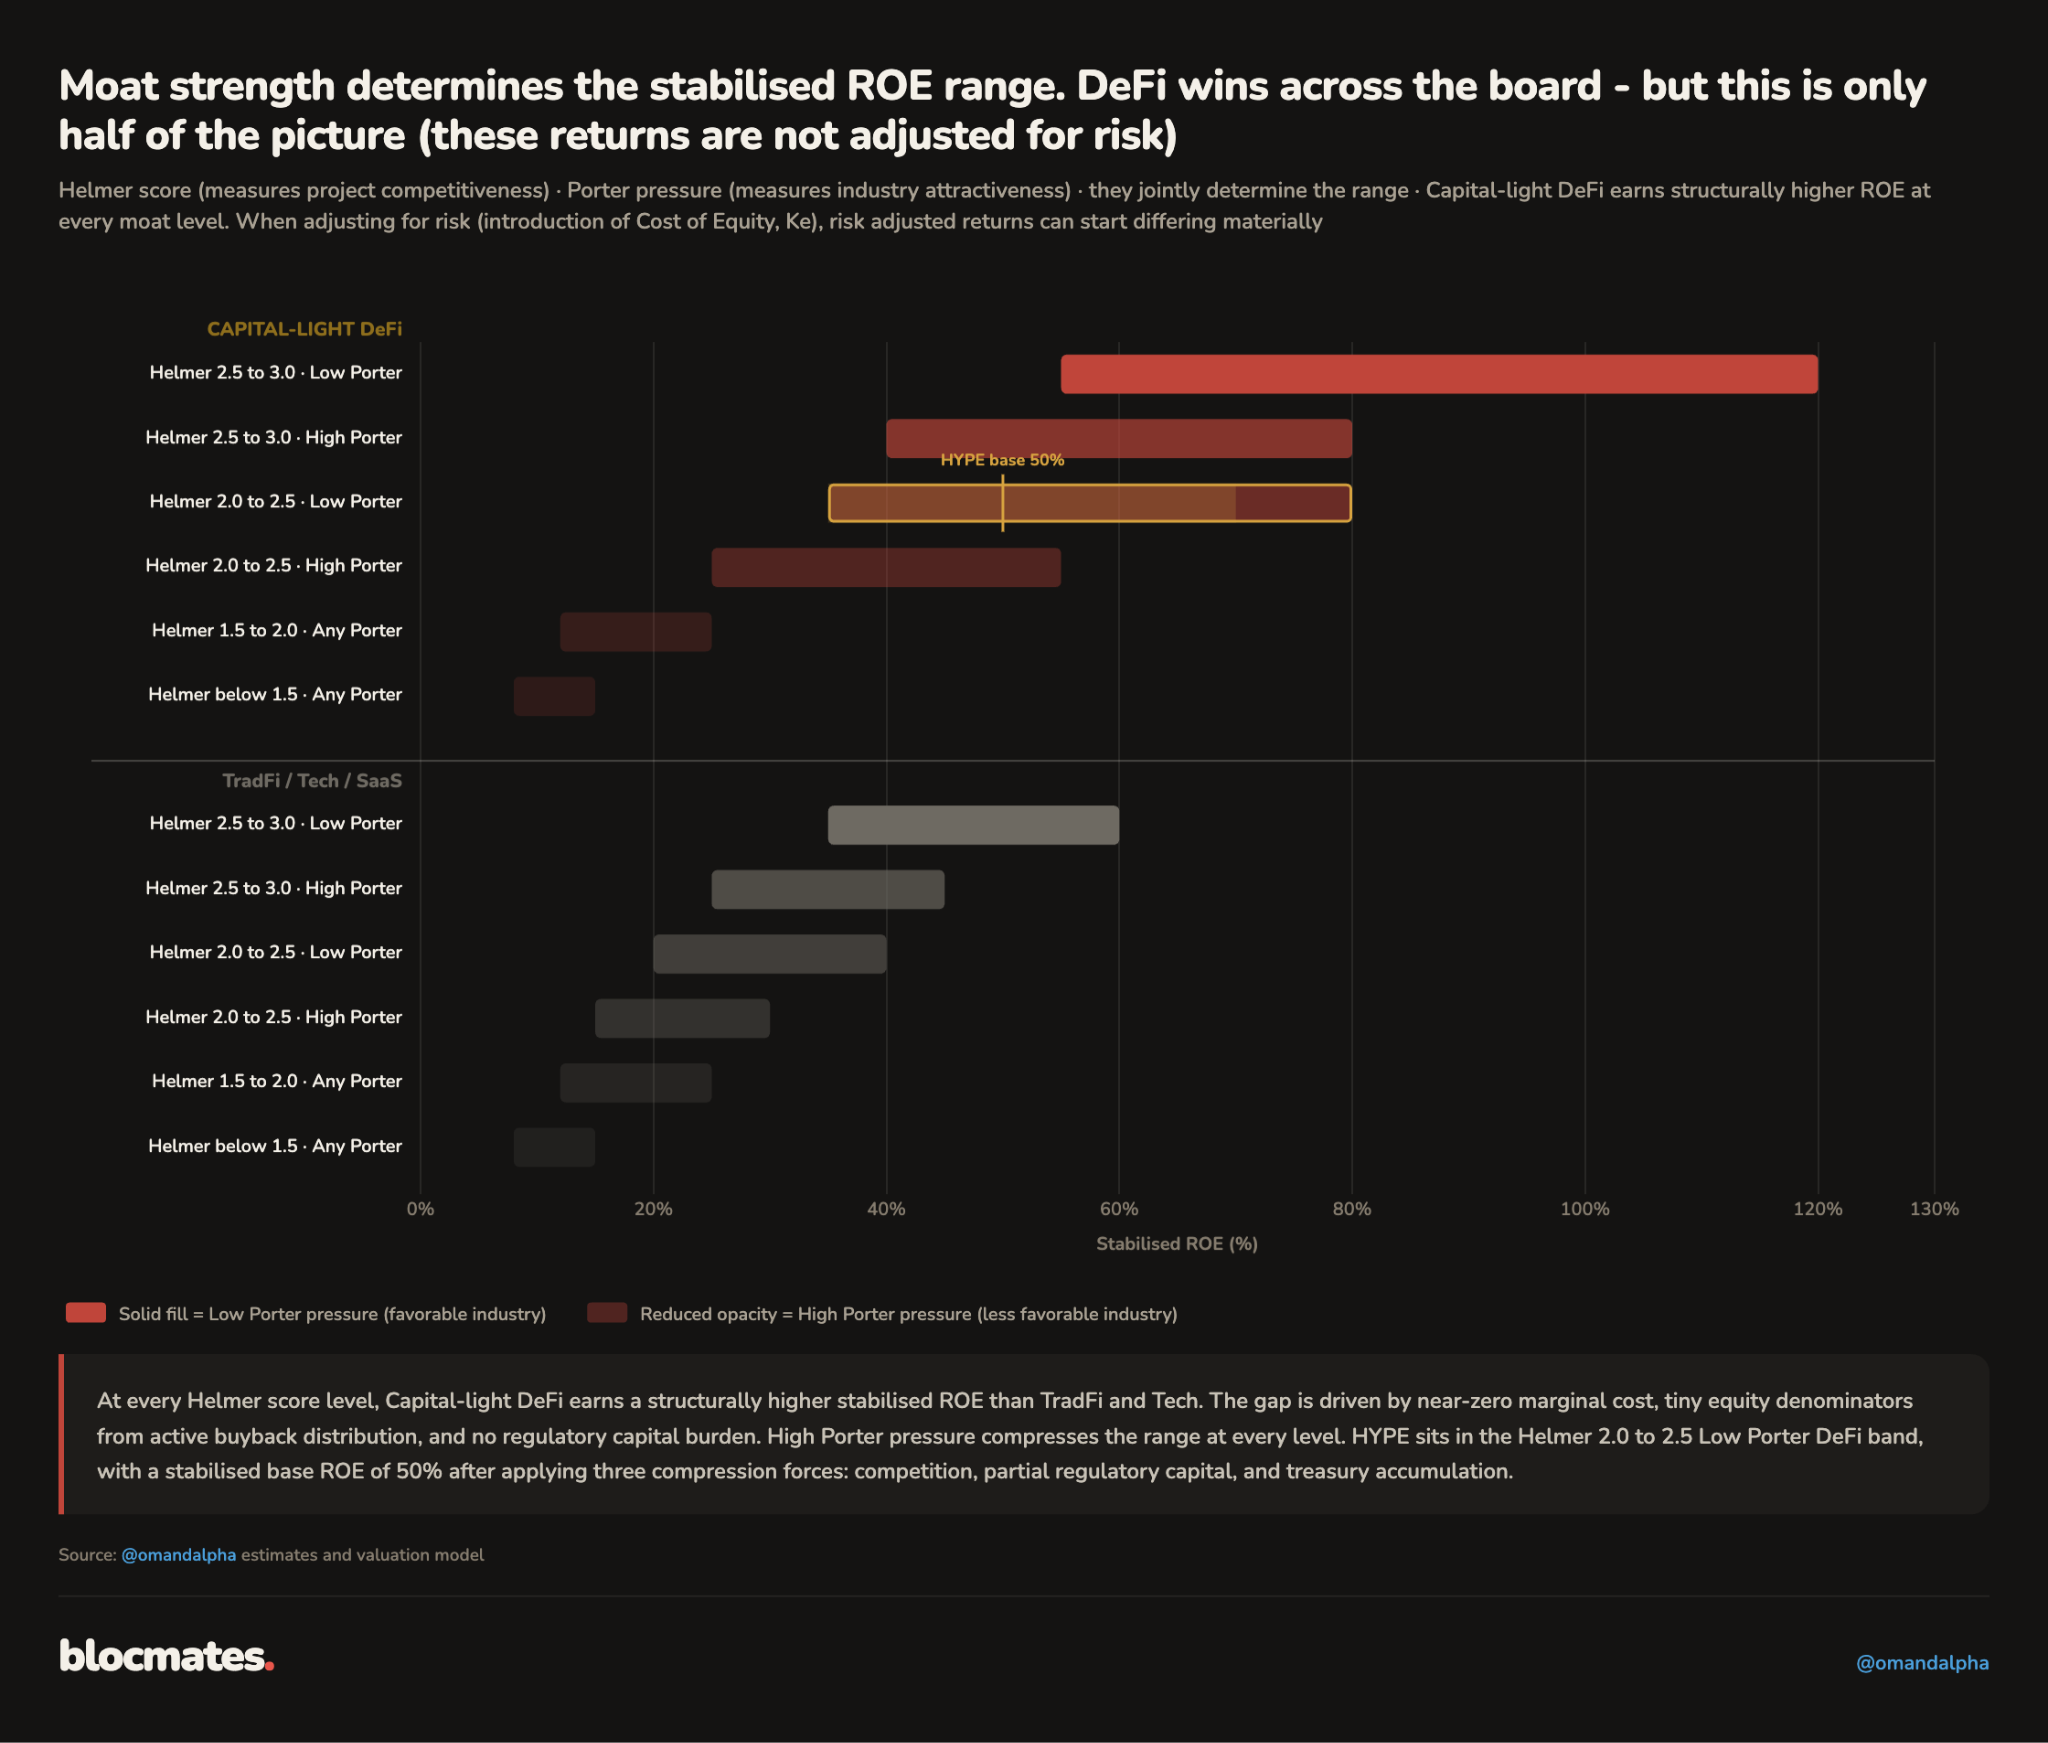
Although most of DeFi is still in a hypergrowth phase, we expect stabilized ROEs to settle at levels much higher than what is observed in TradFi, tech, or SaaS.
This is because DeFi does not need the balance sheet and regulatory capital that its traditional counterparts need.
This, however, does not mean DeFi protocols by definition are more attractive investments, as these returns are unadjusted for risk (we adjust for this in our Cost of Equity section).
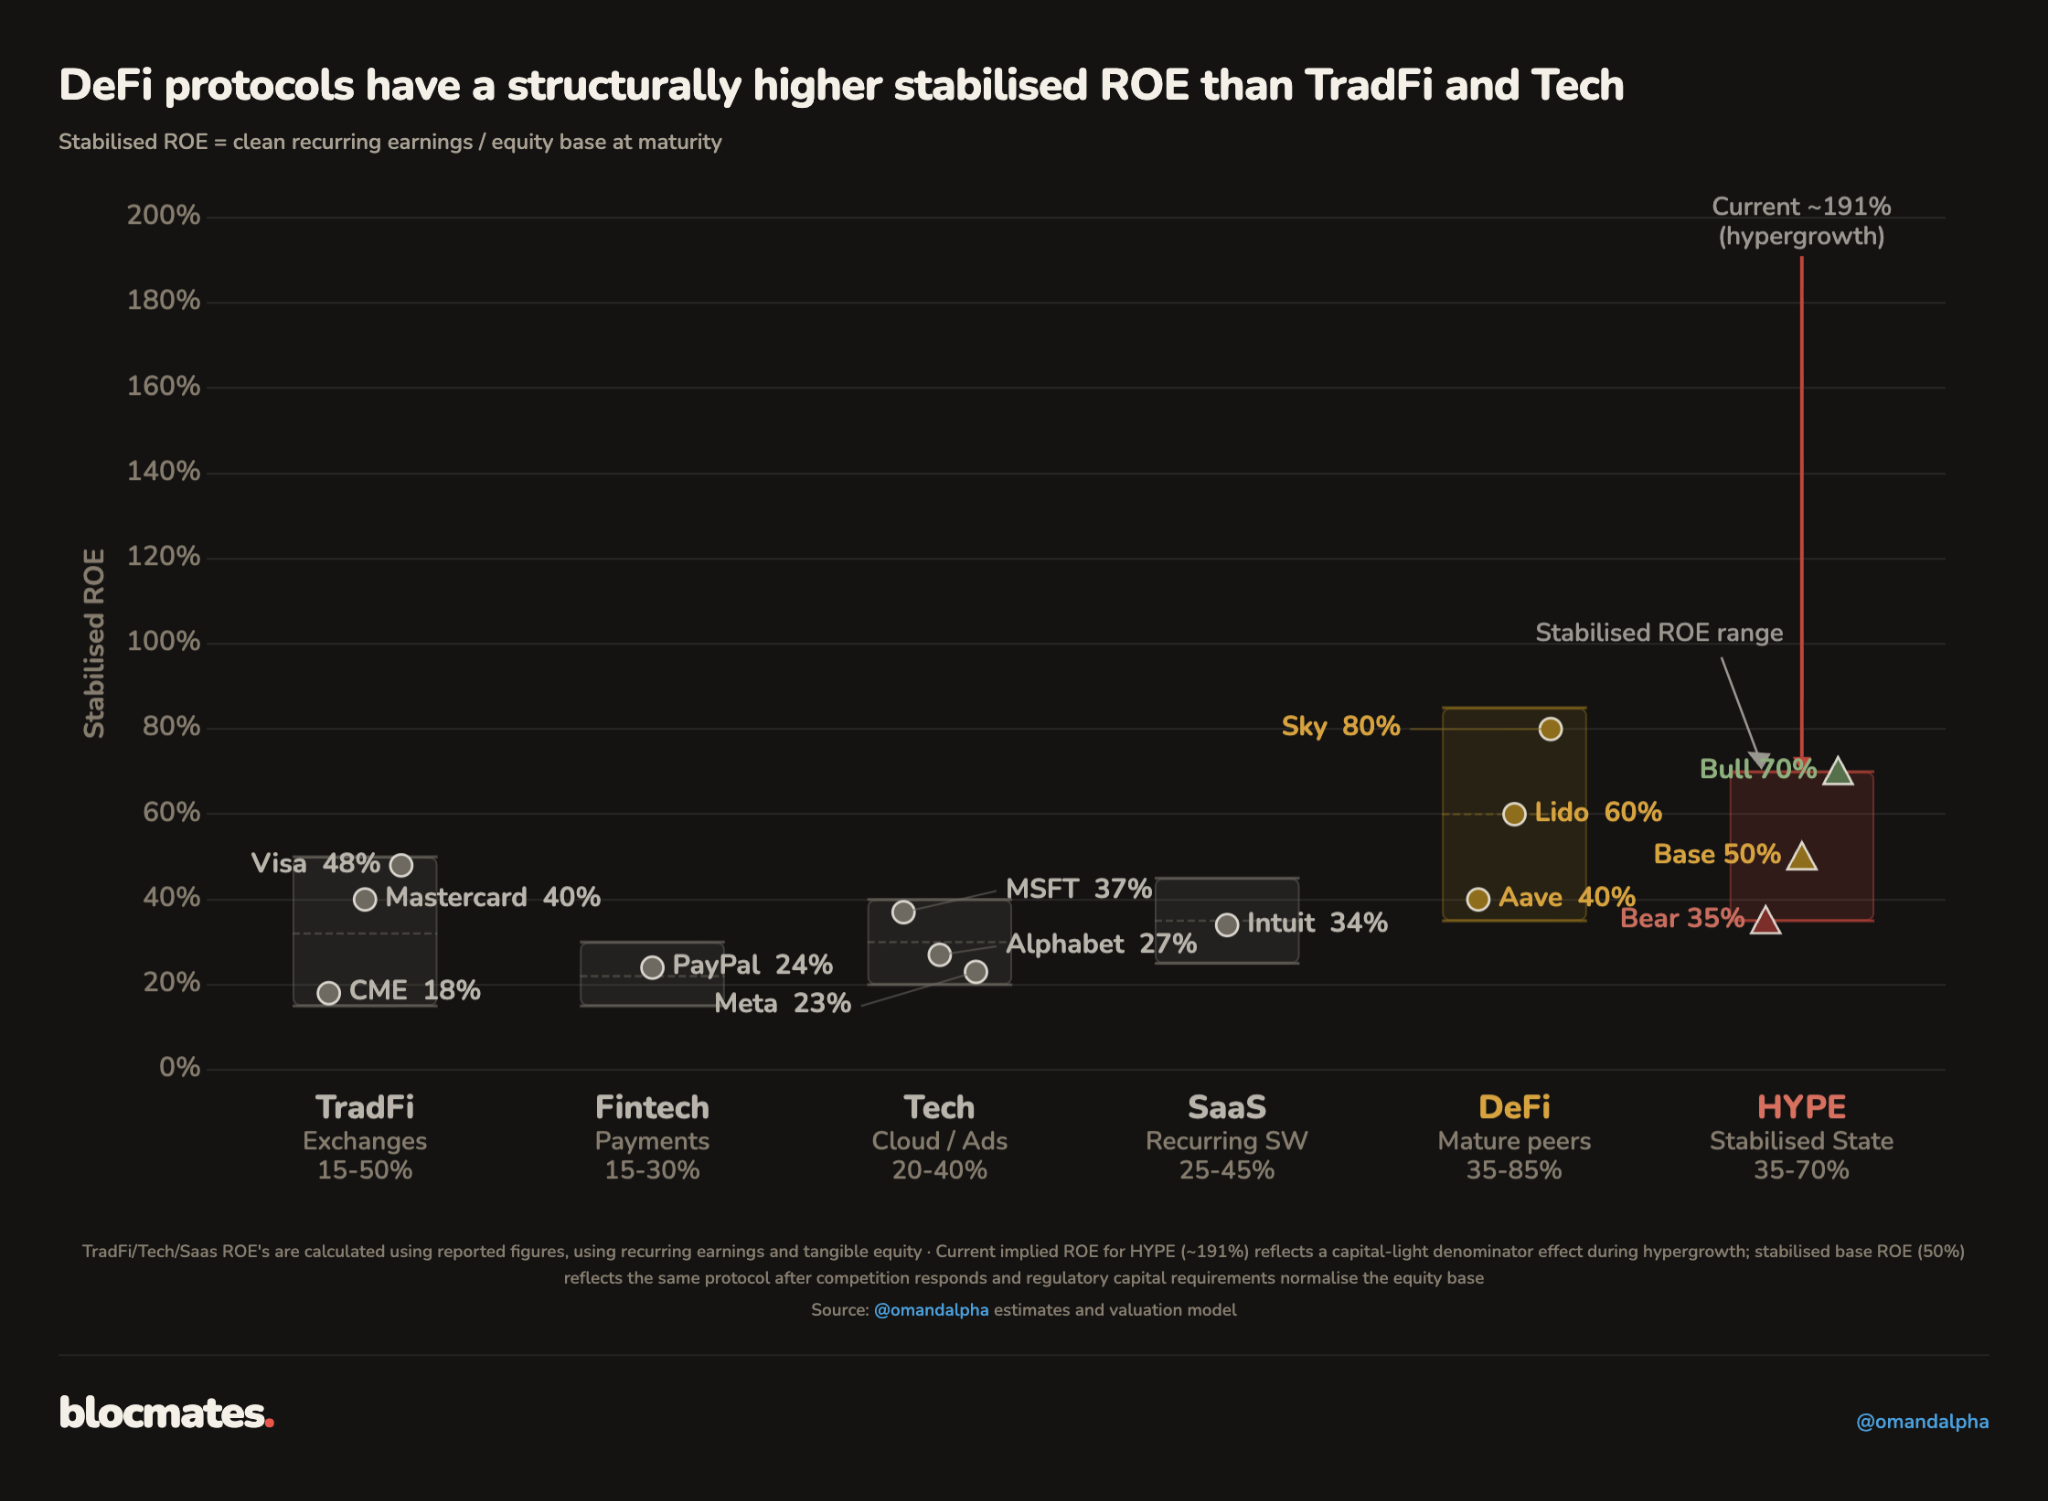
For example, using reported recurring earnings and balance sheet data for traditional business models, we derive the following stabilized ROEs:
- TradFi settles between 15%-50%. CME, Mastercard, and Visa show c.18%, 40% and 48% respectively.
- Tech shows an ROE range stabilization between 20-40%.
- DeFi, while still in growth mode, could easily settle between 35-85%, which is the range we will use for bear, base, and bull stabilized ROEs. We may review these ranges as the DeFi industry matures.
Why is this framework relevant?
As we will point out in the valuation section, most professional institutional valuation methods of hypergrowth business models consist of at least two phases:
- The hypergrowth phase: This is what we capture in the growth CAGR determination.
- The terminal valuation phase: This is the steady state return achieved after competitive forces, innovation, and regulation stabilize the business. A terminal valuation multiple (aka steady state valuation multiple) is derived, and stabilized ROE is a direct input. As higher stabilized ROEs that firmly exceed the Required Return (Ke, see later) will get higher terminal valuation multiples.
- Sometimes an intermediate growth stabilization phase is modeled, which we leave out for now for simplicity.
We use two frameworks to establish the stabilized ROE:
- Helmer’s 7 powers measure the competitiveness of a protocol versus peers. A higher score is better.
- Porter’s 5 Forces measures the attractiveness of the industry. A lower score is better.
Applying these frameworks to the Core Perps and HIP-3 segments, we derived very strong moat scores for both, with HIP-3 outperforming Core Perps, the top contributing factors being:
- Switching costs and cornered resource: the 500k HYPE deployer bond, roughly $35 million at current prices, creates economic lock-in, making it very difficult for a builder to switch platforms.
- Industry pressure: HIP-3 operates in a near-monopoly. Ostium and Variational offer RWA perp markets, but they are venues, not platforms: a trader can access RWA perps there, a builder cannot deploy one. For permissionless perp deployment on a native layer-1 with over $9 billion in open interest depth, no substitute exists. Supplier power and buyer power are both zero.
- Counter-positioning: Centralized exchanges cannot offer permissionless builder deployment without dismantling the custody model their licenses depend on, and Ethereum L2s lack the execution speed RWA perps require.
- Inherited network effects: A builder launching on HIP-3 gets $9.2 billion of OI depth on day one. A competing platform starts at zero.
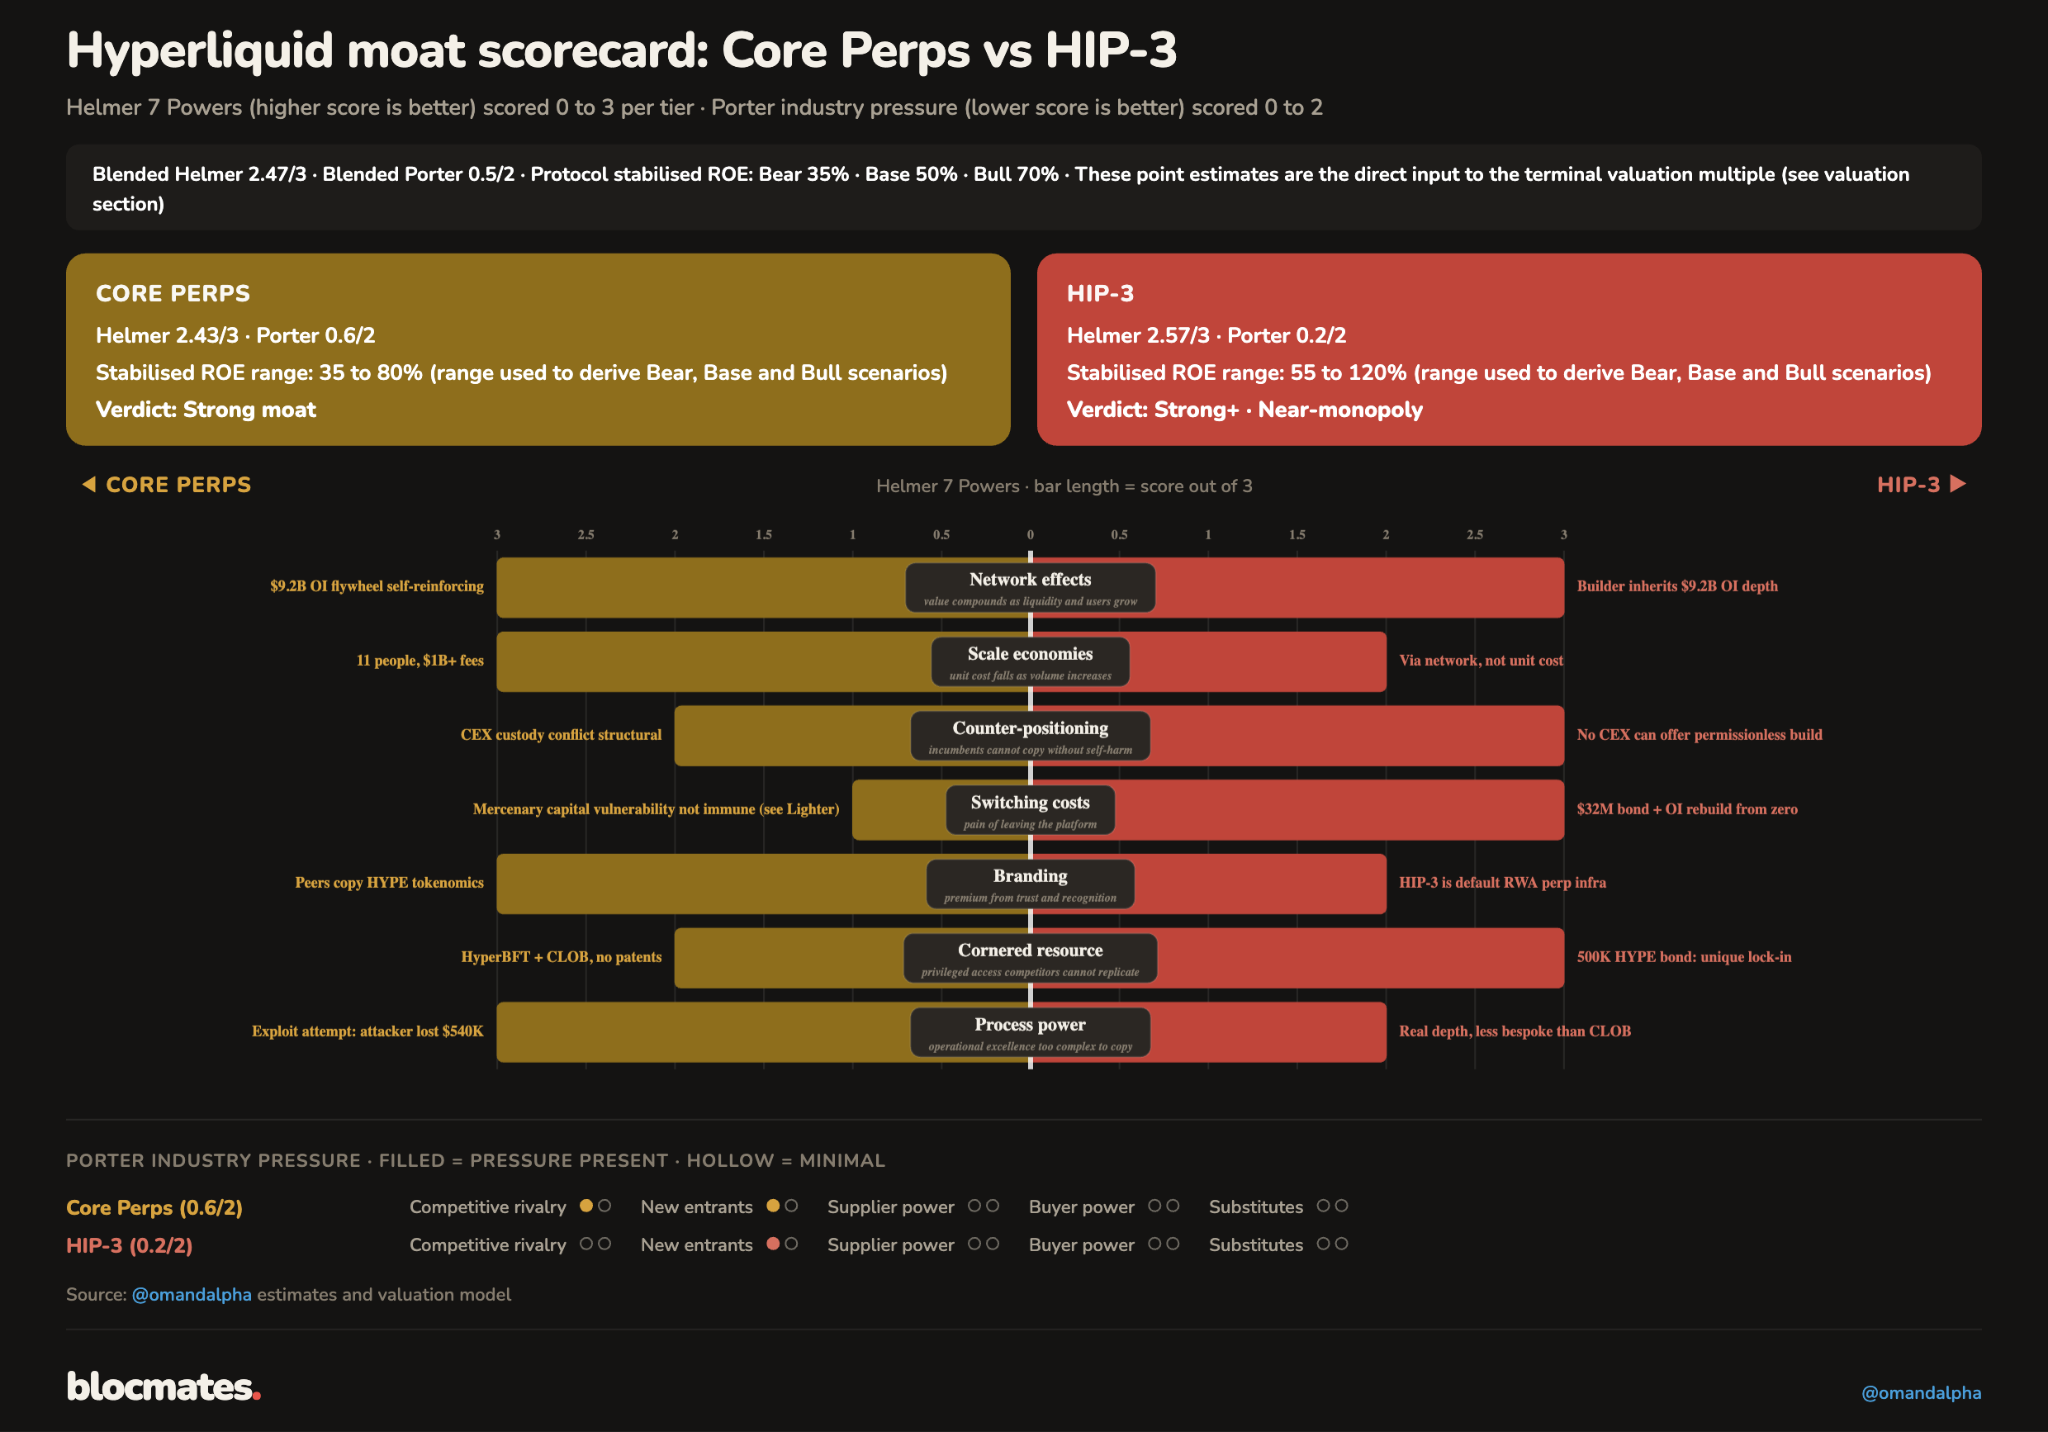
Once we obtain the moat scores, we mechanically derive the stabilized ROE range, which for HYPE comes out at 35%, 50%, and 70% in bear, base, and bull case scenarios. We will use the same derivation table across the DeFi universe, making the exercise extra relevant for relative valuation, portfolio composition, and relative value assessment.
The biggest risk to the moat score would be a sustained deterioration in OI, bringing the network effects into question, suggesting that competition is more fierce than expected, which would lower the moat score, the stabilized ROE, and our valuation.
The biggest upside to the moat score is HIP-3 builder diversification. Two or three builders generating over $100 million in OI would prove the moat is valid on a platform level and not on a counterparty level.
Step 3: Token supply, dilution treatment, and EPS forecast
How we treat dilution and token overhang
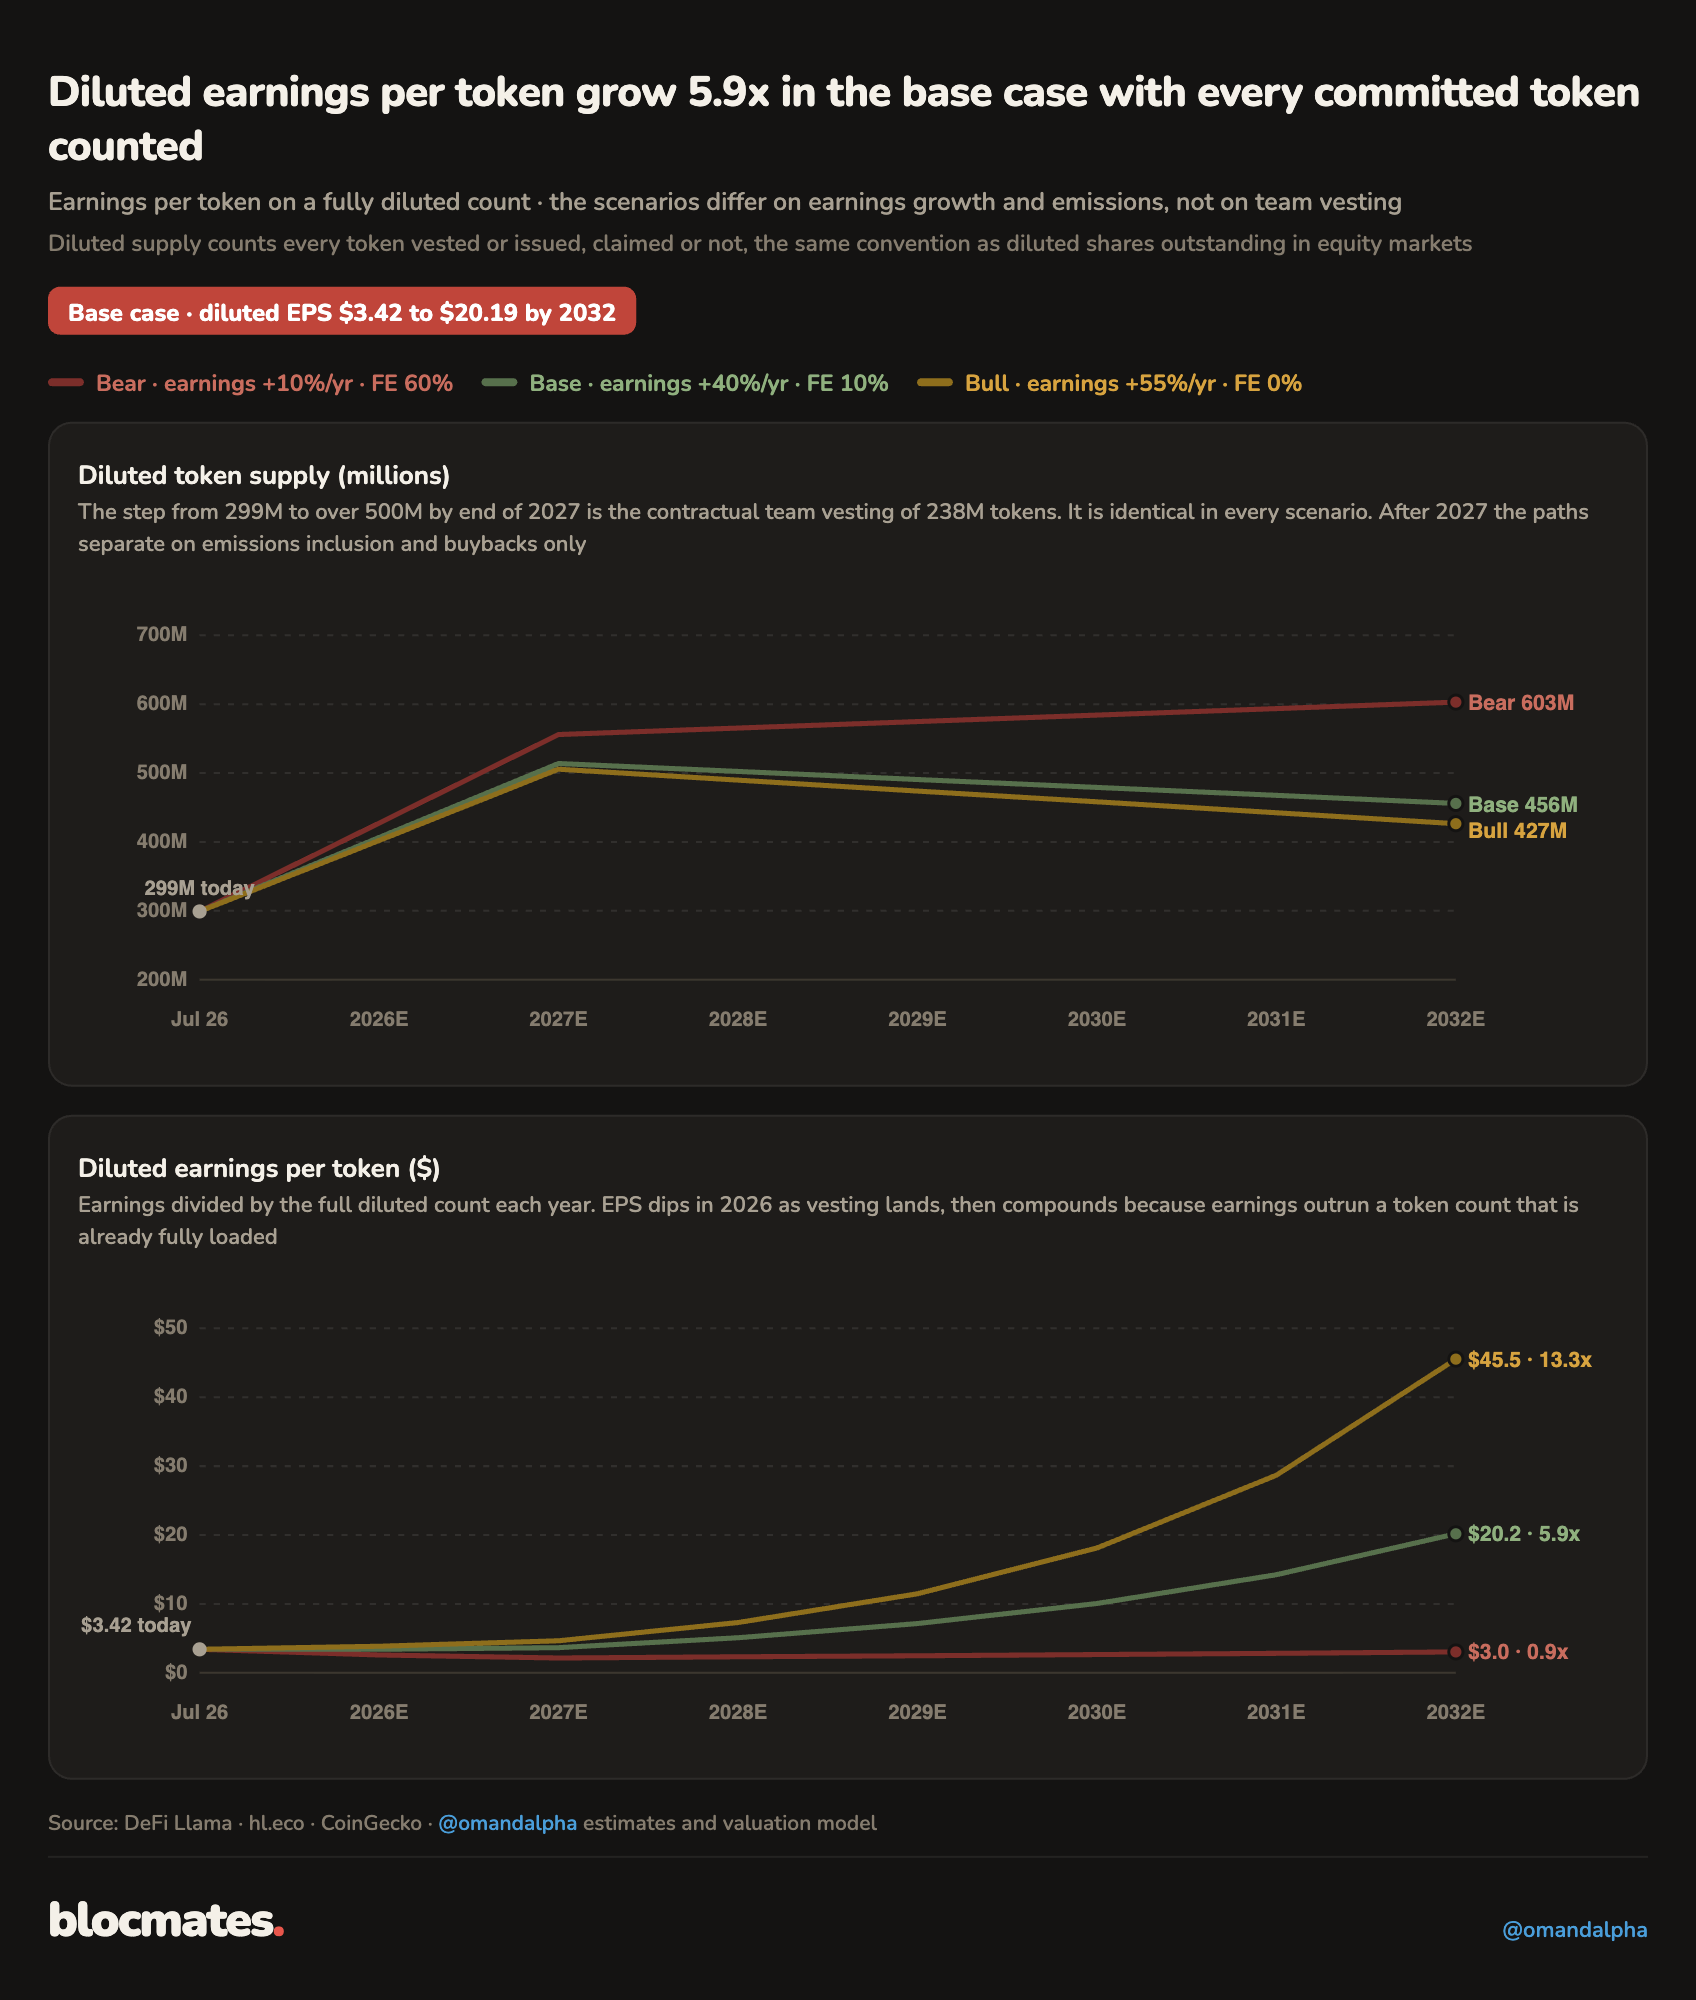
Following best practices in equity dilution modeling, we believe the best way to account for outstanding tokens in a valuation is to neither use circulating (Coingecko 222m) nor fully diluted supply (FDV, Coingecko 955m), but to use Total Outstanding Supply (OTS), which we calculate to end up at a terminal amount of 456 million in a base case, 427 million in a bull case and 603 million bear case scenario.
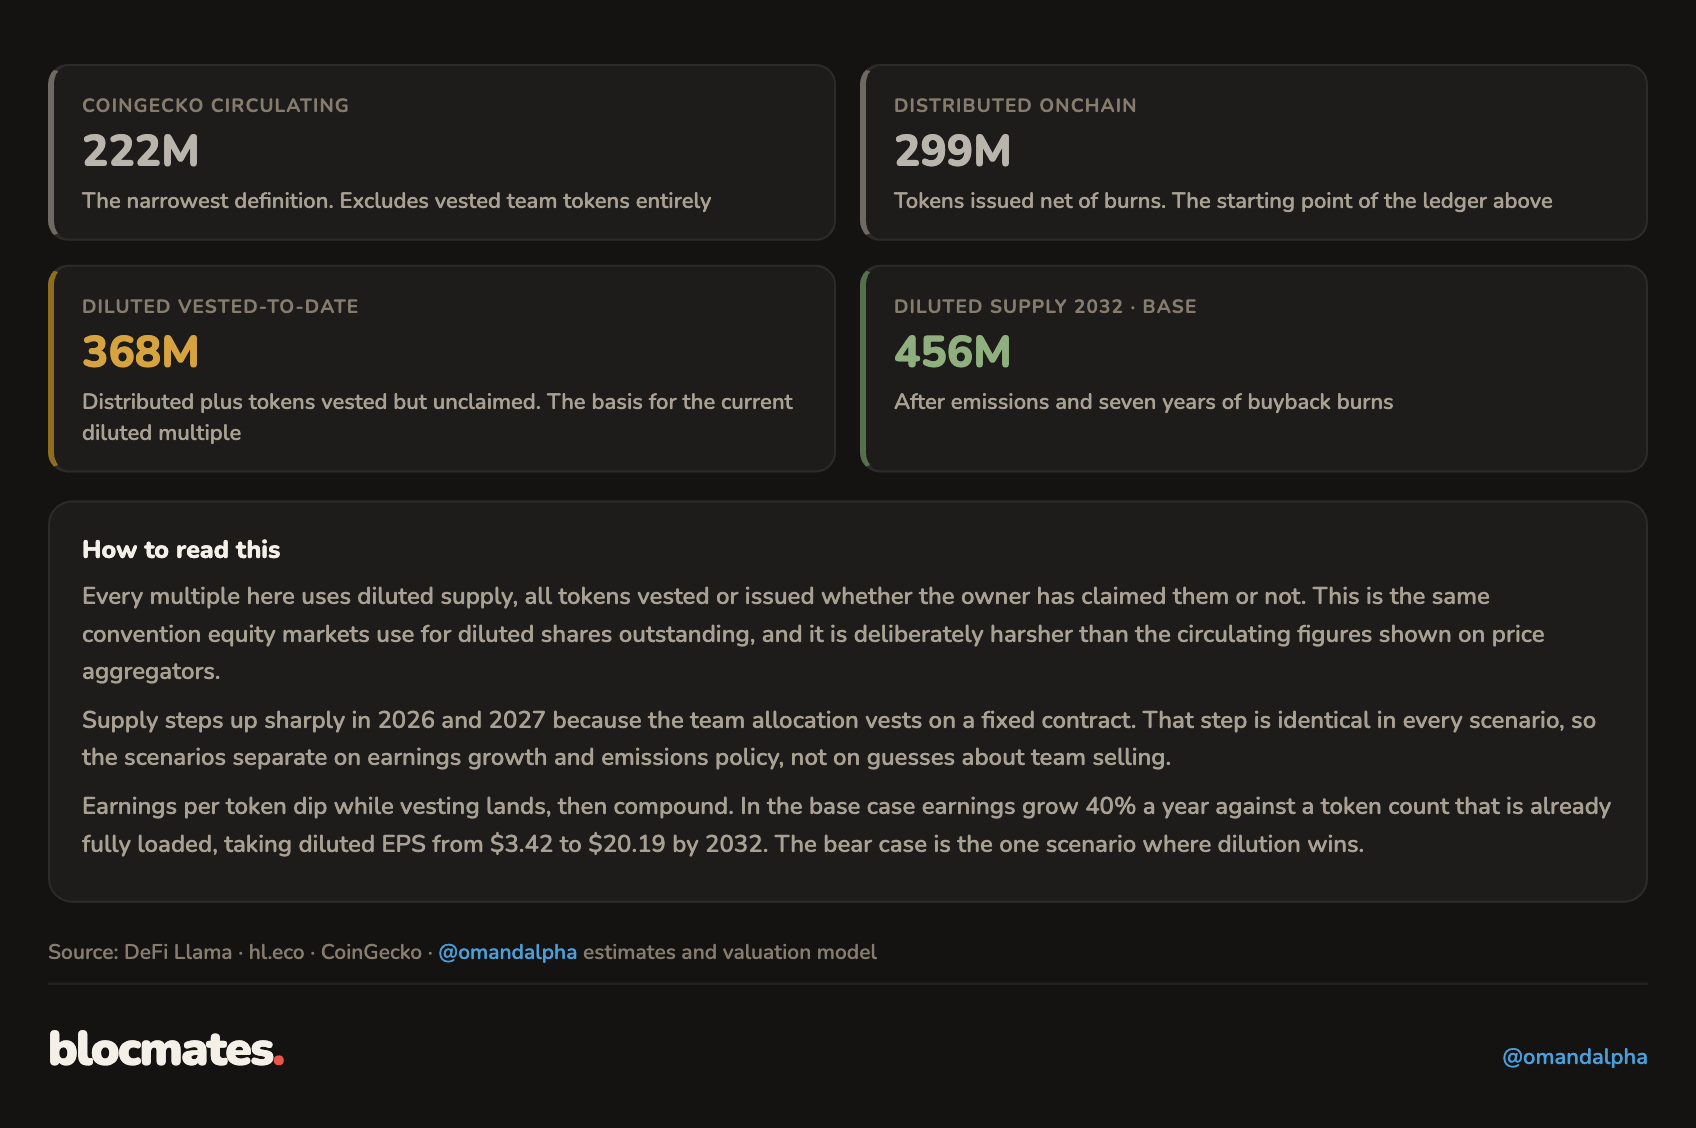
Using circulating supply is inherently wrong and ignores vested team tokens, understating dilution and overstating valuation.
Using FDV assumes every authorized token reaches the market, including those tokens that have no guarantee to ever be issued (the Future Emissions tokens of 389 million), completely ignoring team credibility, which would overstate dilution and understate valuation.
As a rule of thumb, every vested but unclaimed token should be included in the valuation, as it constitutes an economic claim on the protocol. It is fair to say that the team has claimed only a fraction of what is vested every month (only 3-4% of the monthly 9.9m token vestings), but this should not matter in a valuation.
This is the same convention equity markets apply to diluted shares outstanding (e.g., convertible bonds that are in or close to the money on the investment horizon, warrants, etc).
Future emissions are a different object.
The 389 million authorized but unissued tokens carry no vesting contract, so including them is a probability judgment about a decision the team has not made.
The test here is accretion: deploying a token creates value only when the return on that deployment exceeds the cost of equity, the same standard equity markets apply to share issuance.
A protocol earning $1,074 million clean earnings a year is self-sustaining and does not need emission-funded growth.
Also, there is the topic of alignment of interest and signaling: the team is the largest holder, so it has an interest in only using the Future Emissions token pool if it adds more value than what dilution destroys.
For this reason, we assume a mere 10% of future emissions in the base case and 0% in the bull. The bear includes 60%, reflecting a scenario where this capital usage discipline fails due to competitive pressure, requiring dilutive capital issuance in order to protect market share and the moat.
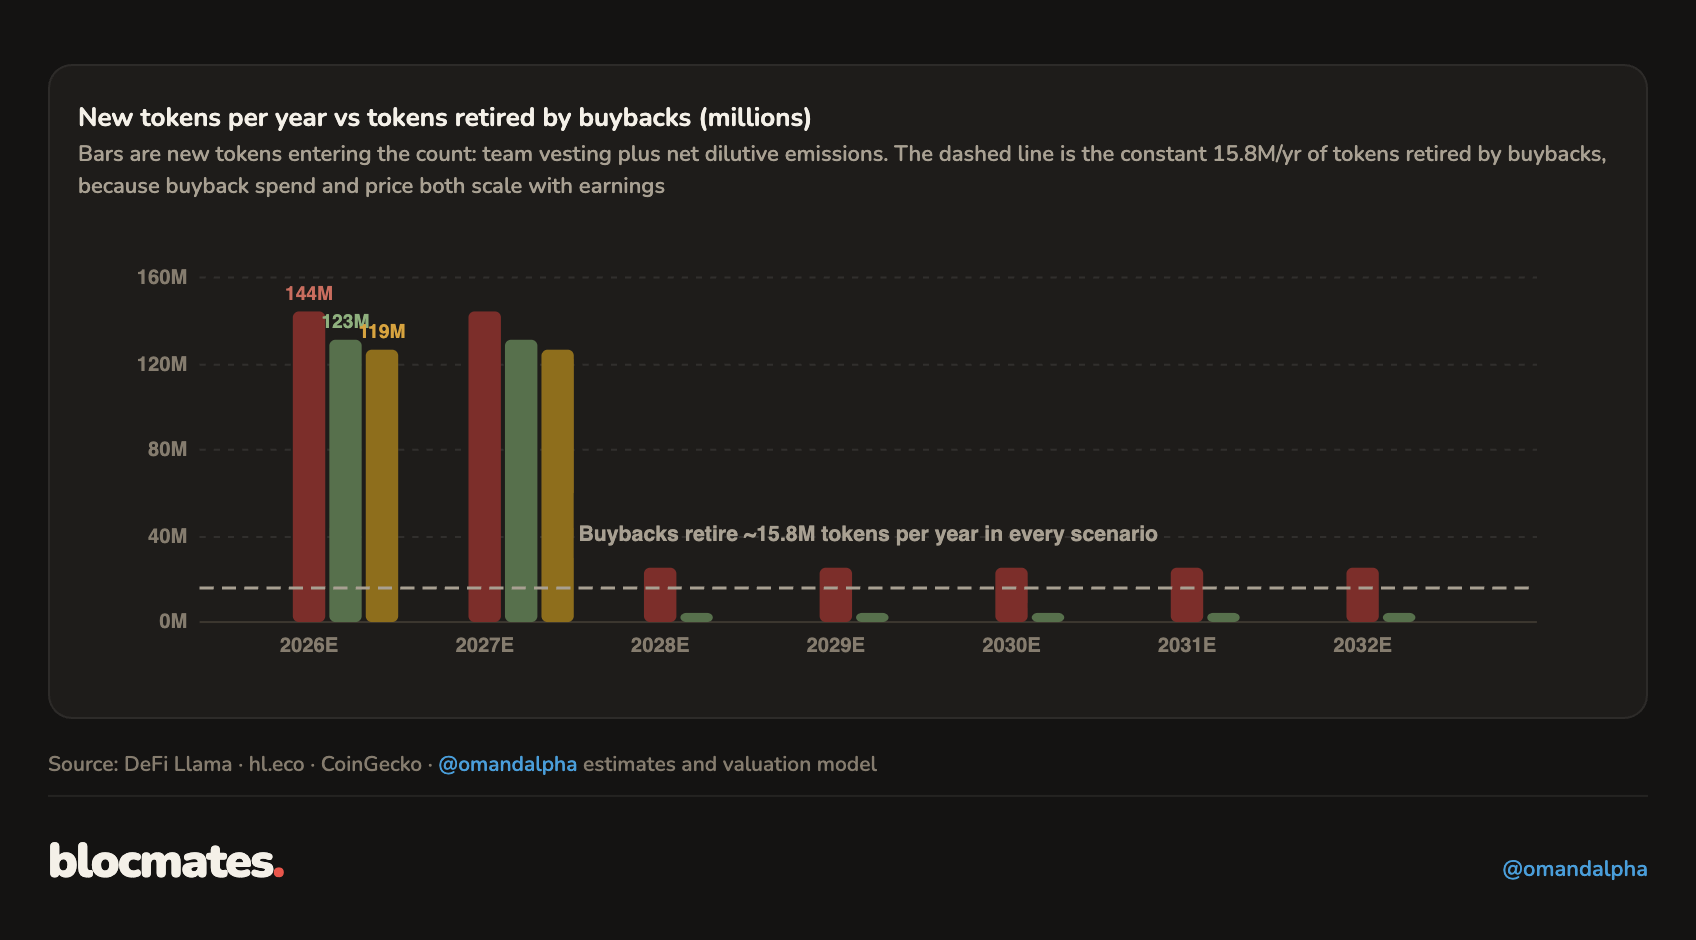
Buyback modeling
Buybacks offset the dilution, and this becomes particularly clear after the Core Contributor vesting period ends.
They retire a near-constant 15.8 million tokens per year in every scenario.
While this may seem confusing initially, it makes sense as we assume the buyback price will move in tandem with the earnings growth: higher earnings growth means more value is available for buybacks, but at the same time, the token price is expected to rise accordingly.
This is how we underwrite a near constant amount of token buybacks per year.
Also, the accretive effect of buybacks becomes clear from 2027 onwards, when all core contributor tokens have vested and participate in the diluted token count.
As a result of our growth rate and token dilution modeling, we derive a base case 6x growth in diluted EPS over the next 7 years, from $3.4 today to $20.2 in 2032.
This is an EPS CAGR of 30% (note that this is below the base case earnings growth rate of 40% due to the dilutive impact of Core Contributor token vestings).
The bull case is even more aggressive: no dilution from Future Emissions, along with a total protocol level growth rate (55% CAGR), underpins a 13x growth in EPS, or an earnings CAGR of c.50%.
Step 4: Required return
After analyzing business growth, moat strength, and dilution, it is time to look at the other side of the coin.
What is the risk of investing in a perp exchange, or even more general, what is the risk of investing in a DeFi protocol versus the alternative TradFi investments?
Sophisticated institutional valuation models rely heavily on the required return, or cost of equity (Ke), which is the discount rate applied to the expected future cash flows.
While the required return for equity markets is well studied and documented, for both listed and non-listed alternatives, the required return for DeFi is less obvious and is often even ignored in many valuations out there that apply TradFi multiples on DeFi cashflows.
We firmly believe that this is wrong by default, often leads to overly optimistic valuations that are unadjusted for risk.
Also, it is impossible that in the current state, DeFi protocols are assigned required returns below TradFi.
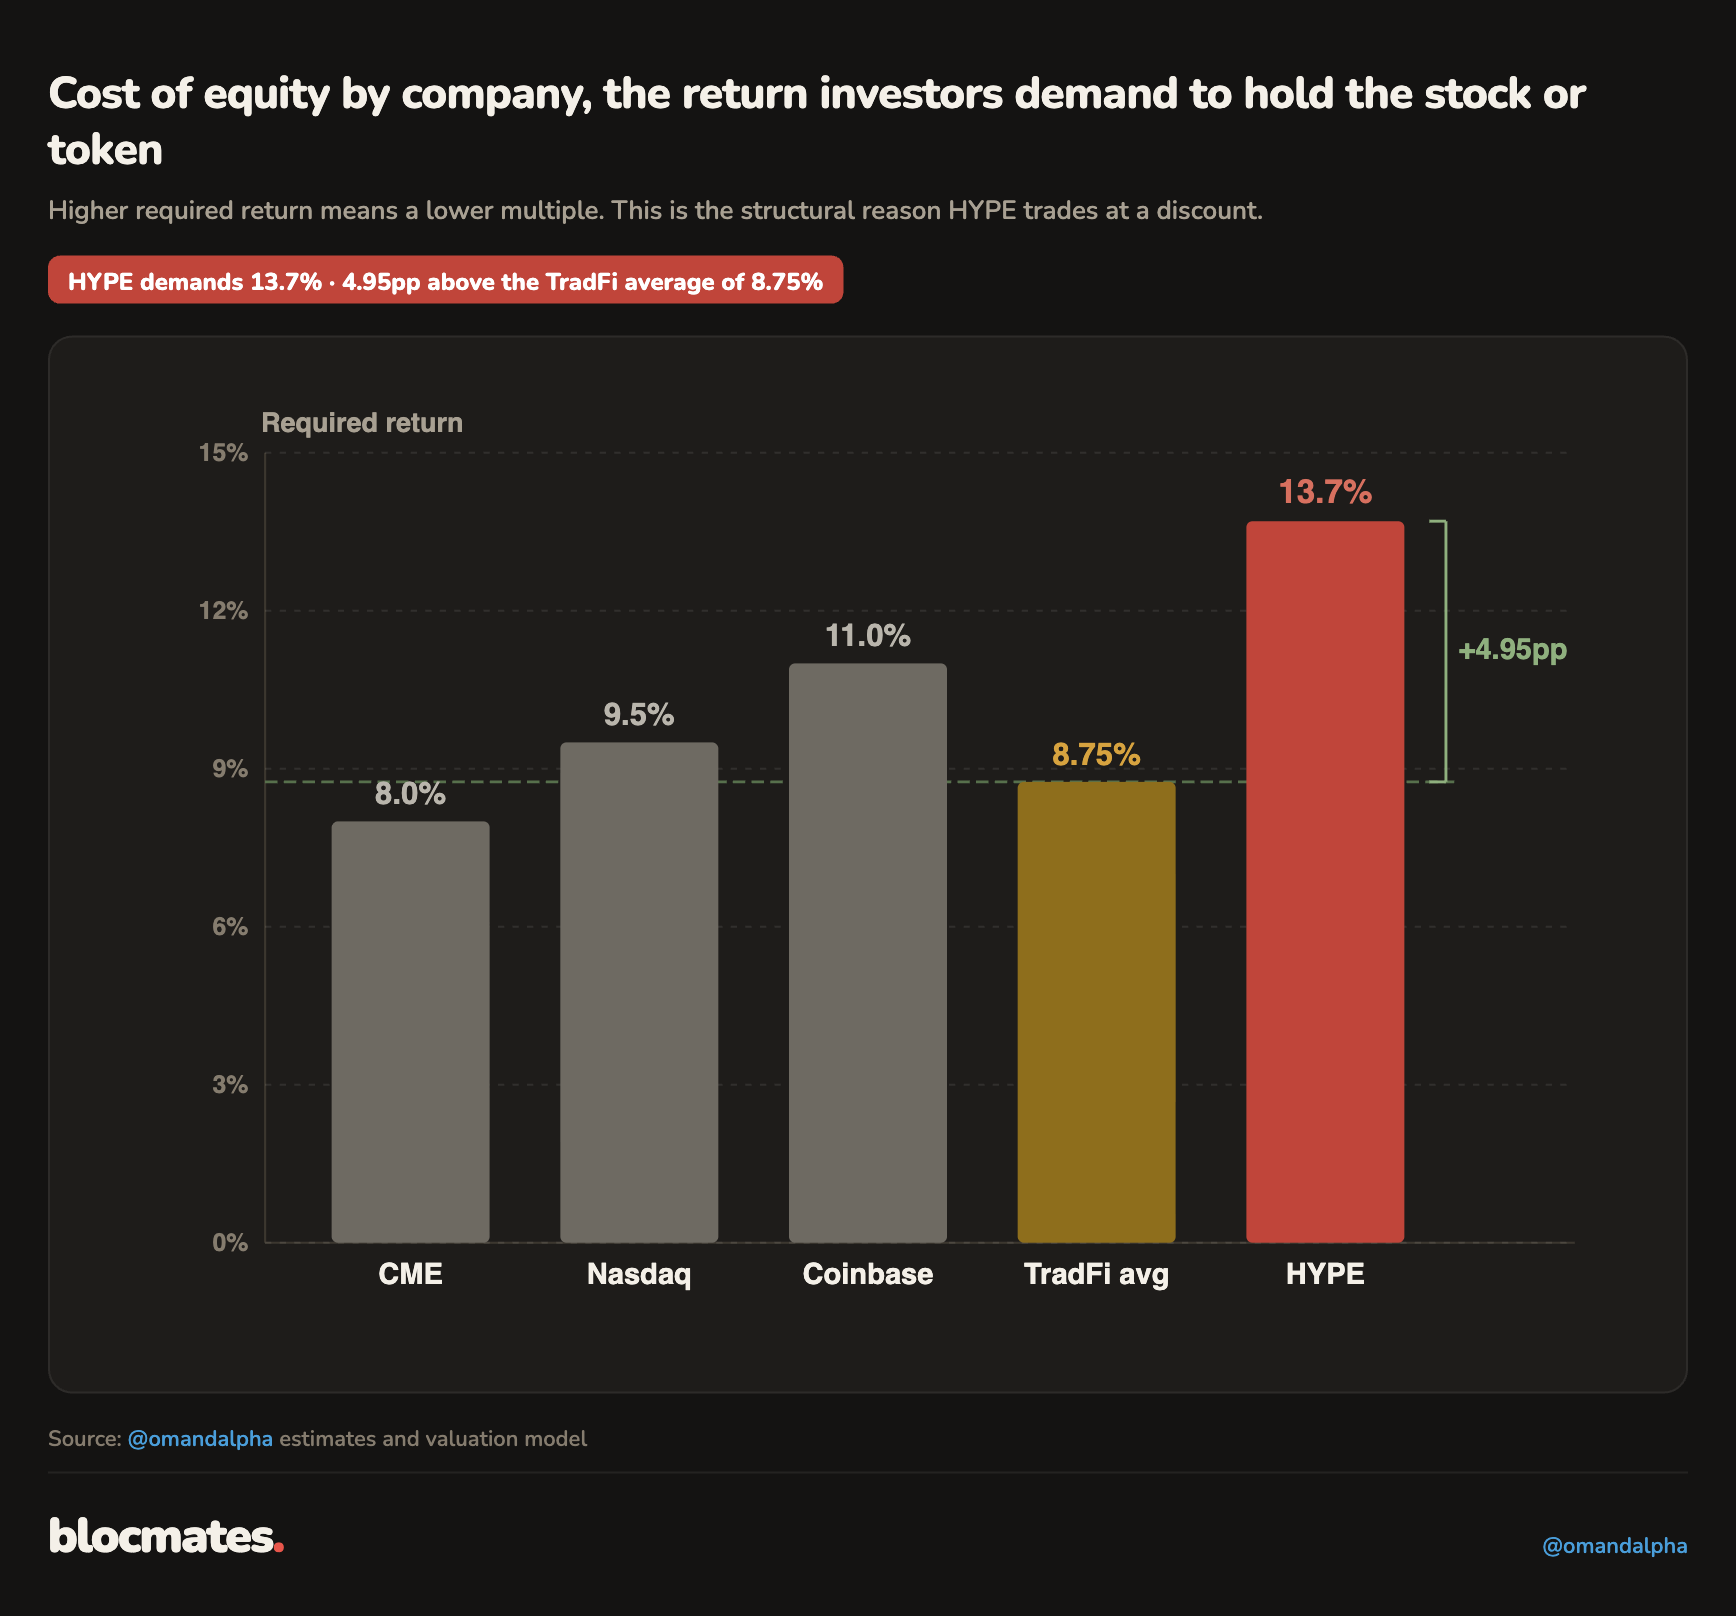
In order to quantify this risk and derive a proper ‘risk-adjusted return,’ we use a multi-layer risk premium model, the first two layers coming from TradFi, added with an intuitive additional four layers of DeFi native risk.
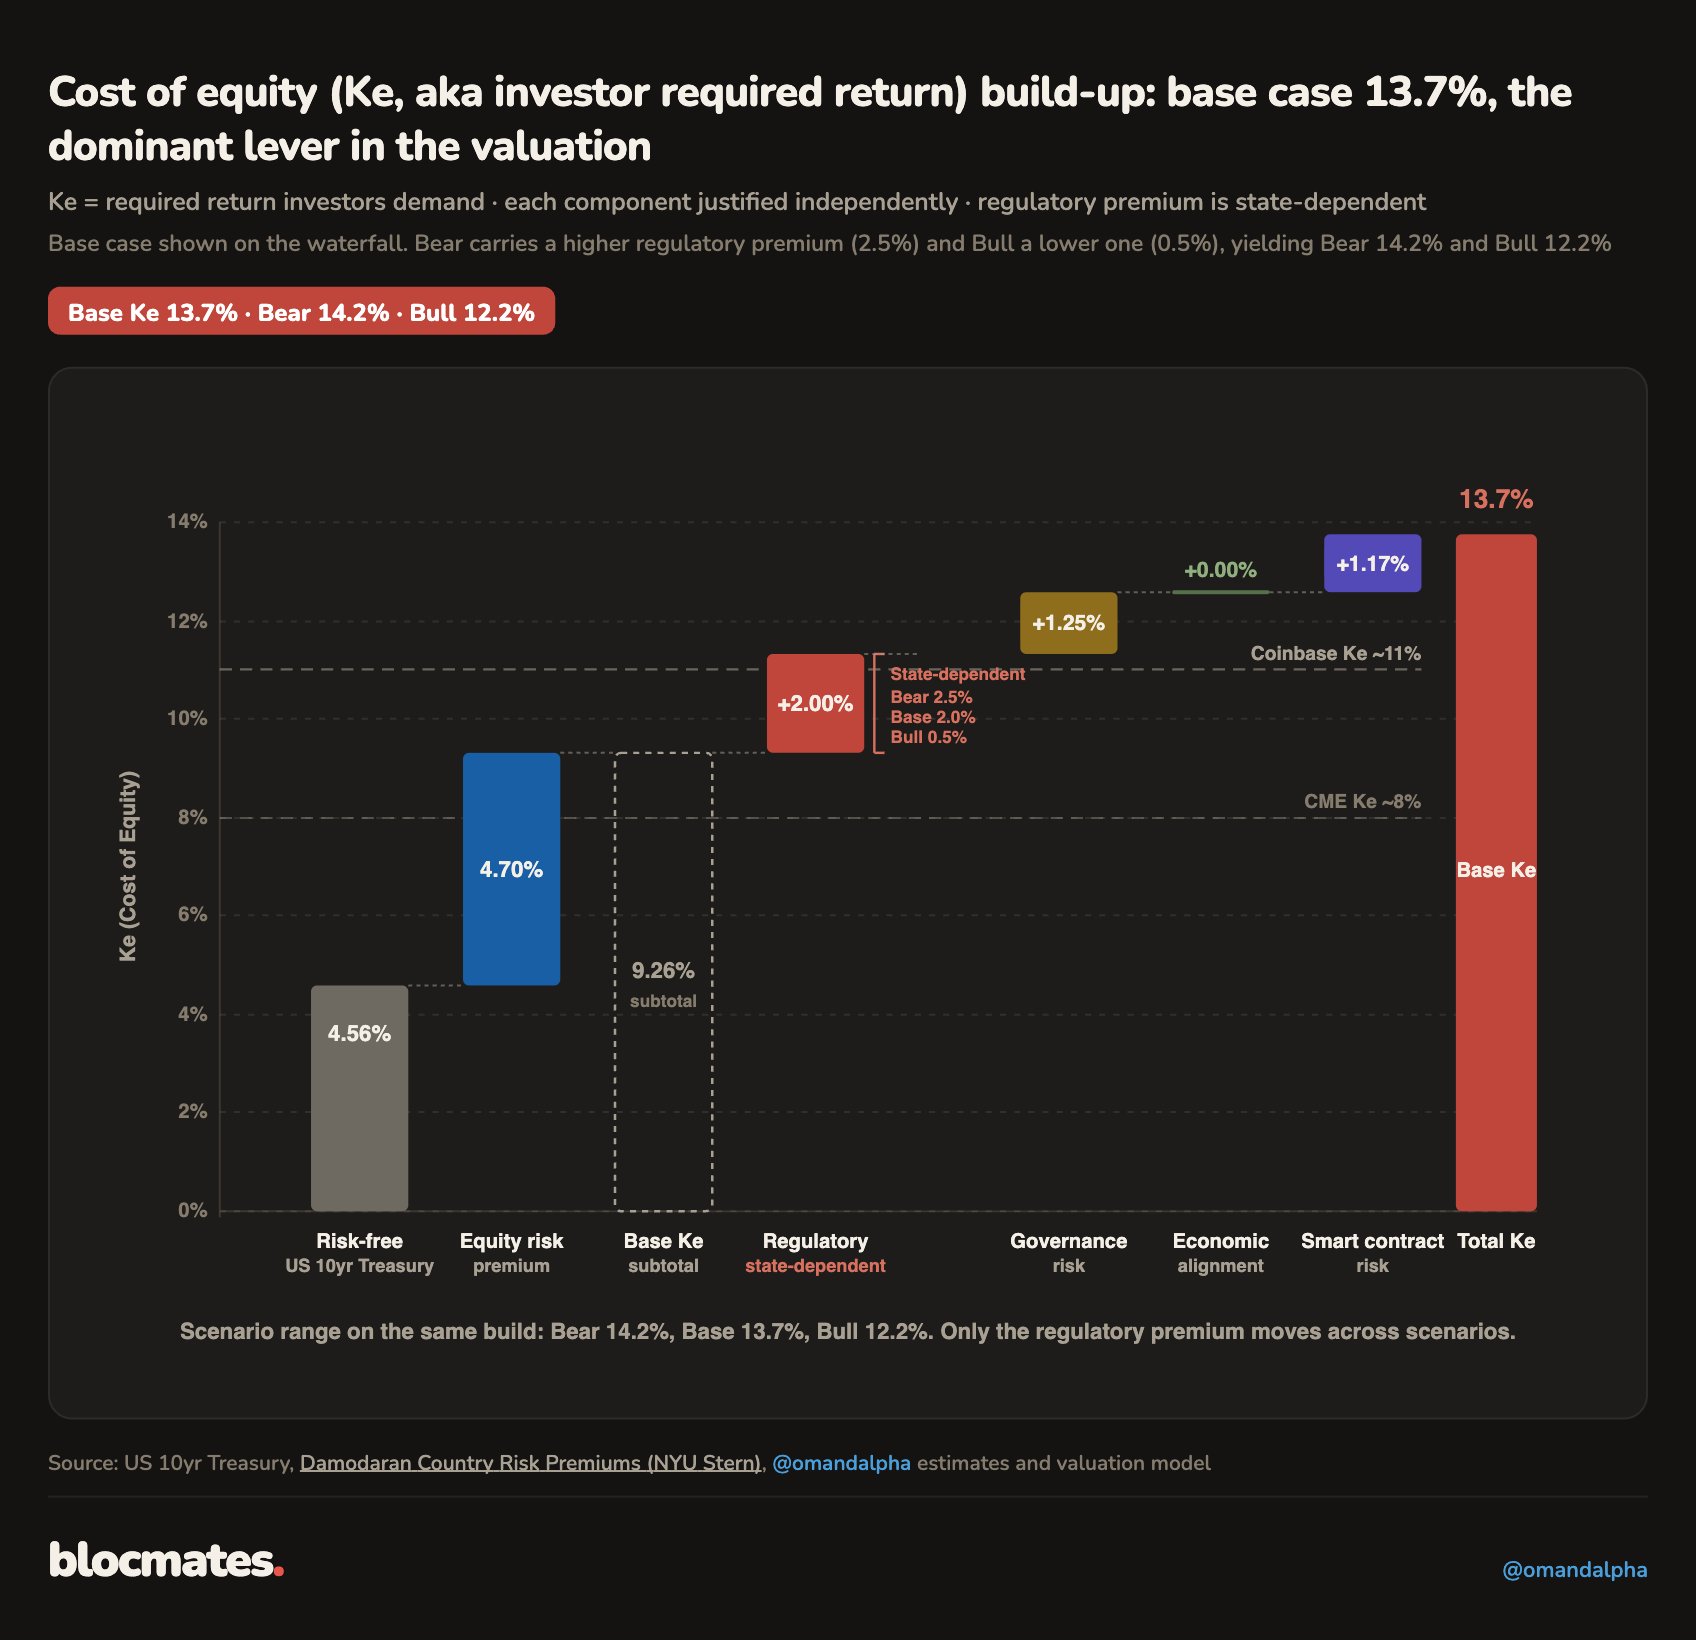
TradFi layers:
- The risk free rate (4.6%): US 10-year bond yield
- Equity risk premium (4.7%): the premium an investor requires for holding the S&P 500 over the risk free rate (4.7%). The determination of this risk premium is heavily studied in TradFi, more info can be found here.
Crypto layers:
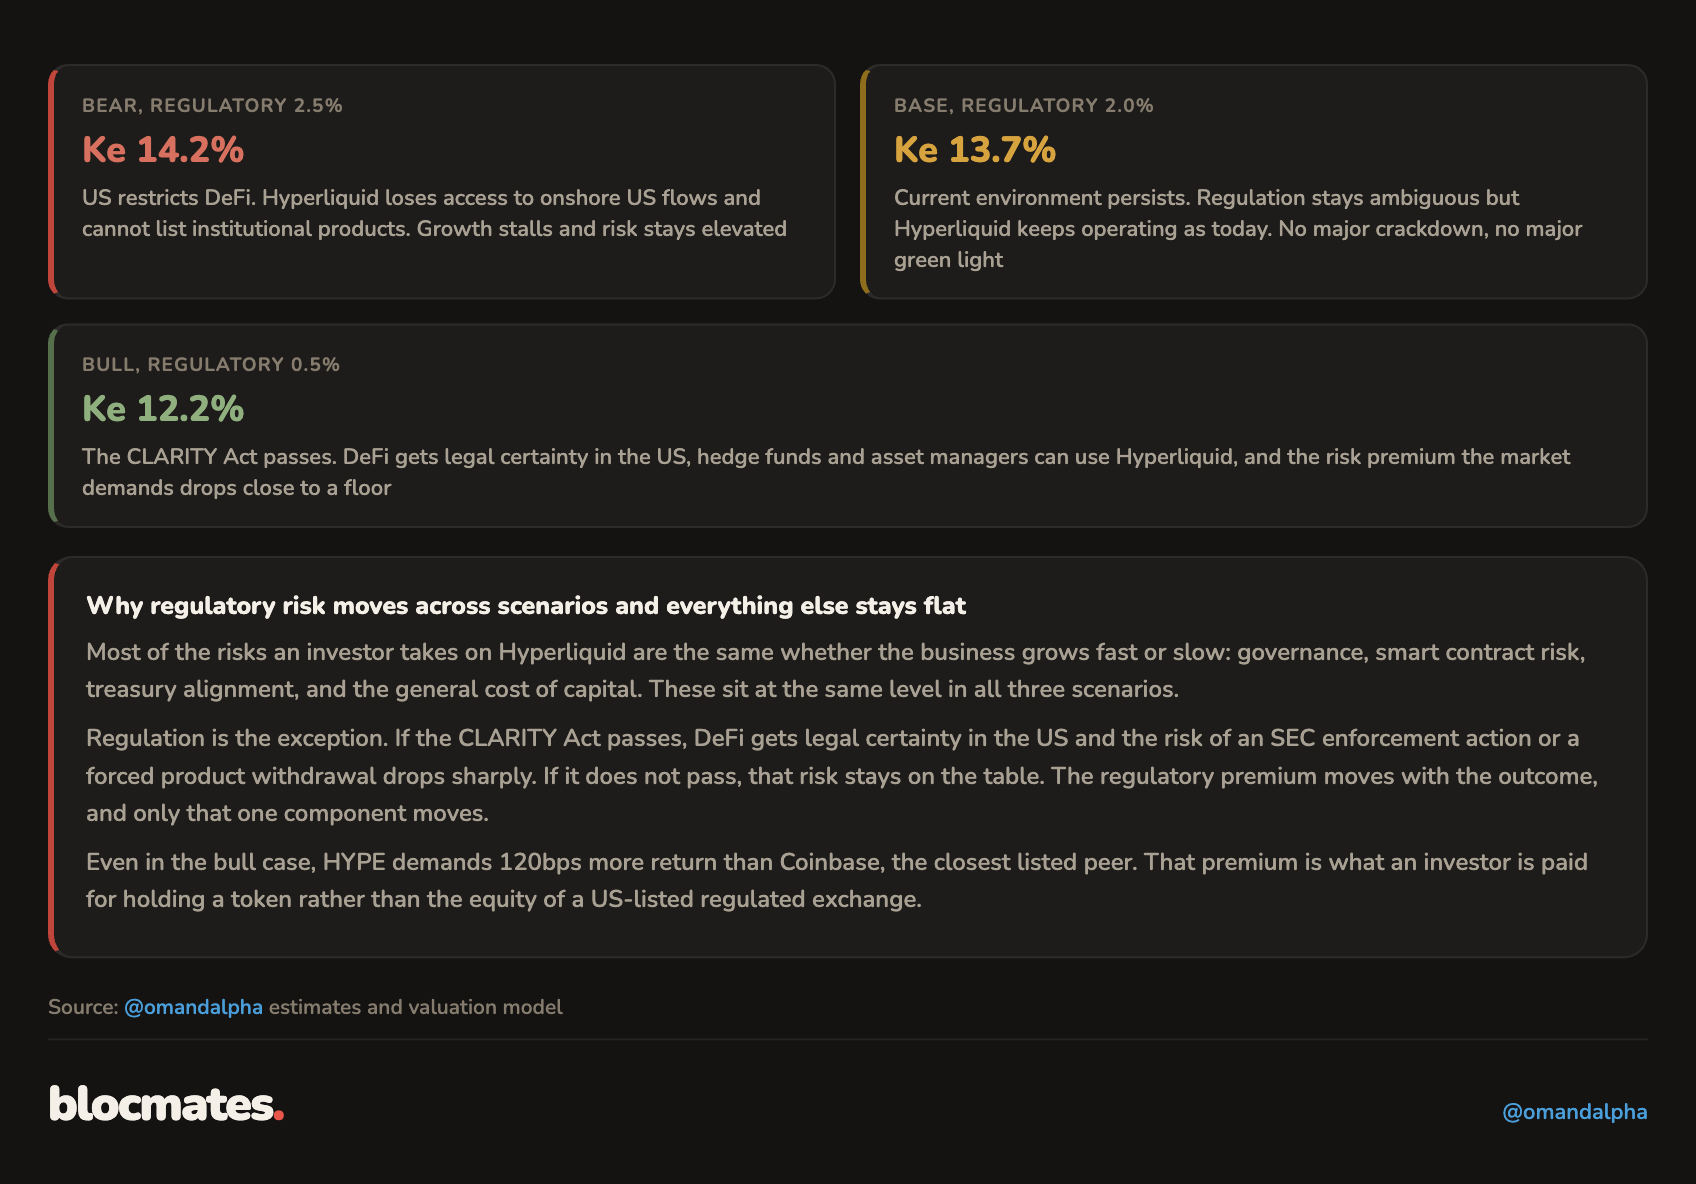
- Regulatory risk (2% base, 0.5% bull, 2.5% bear): The price of operating with no KYC and unresolved US exposure. An enforcement action, a forced product withdrawal, or a ban on US access would hit earnings directly. This is the one premium that moves across scenarios because the bull case cash flows require full and favorable regulatory clarity to exist.
- Governance risk (1.3%): The price of concentrated control. Validators are few, the team can effectively change the rules, and there is no legal wrapper protecting the token holder if it does. Partly offset by the strongest observed alignment in the sector, a team that vests 9.92 million tokens a month and claims 0.32 million.
- Economic alignment (0%): The price of the gap between protocol earnings and token holder cash flows. For most DeFi tokens, this is a large premium: earnings sit in a DAO treasury behind a fee switch that may never turn on. HYPE routes near 100% of earnings to buybacks mechanically, no vote, no discretion, so the gap is zero and the premium is zero. This zero is one of the strongest features of the token.
- Smart contract risk, 1.2%: The price of code that holds a billion-dollar vault. It decays with every month of exploit-free operation, reaching its 0.5% floor by late 2027, because surviving in production is the only audit that counts. A major exploit resets it to the full 2% overnight.
It is very likely that, whilst these pricing models are often proprietary information, institutional capital uses risk-adjusted return frameworks that intuitively reflect these layers discussed above.
As institutional capital is expected to enter the crypto universe going forward, it makes sense to adopt a similar way of thinking in capital allocation and portfolio diversification sooner rather than later in order to get ahead of the curve (i.e., generate outperformance).
As we will point forward to in the next valuation section, this required return is also the biggest swing factor in a valuation, the more so for high-growth protocols and businesses.
This is also why we expect the correct understanding of risk, risk premiums, and risk-adjusted returns applied to decentralized business models to be the lowest-hanging fruit when trying to achieve longer-term outperformance.
Step 5: Valuation
Valuation method 1: DCF (PW and bull scenario upside potential of 68% and 301%, respectively)
We determined the proper risk adjusted cash flows, time to sum it all together.
Four things need to be true in order to switch from the base case to the bull case.
Regulatory clarity: The Clarity Act passes, giving DeFi legal certainty in the US. The direct result: the enforcement scenario dies, hedge funds and asset managers can use and hold HYPE, and the regulatory premium in the required return collapses from 2.0% to 0.5%.
That is the entire reason the discount rate falls from 13.7% to 12.2%: nothing else in the risk stack moves, because governance, code, and alignment risk are the same in both worlds. Regulation is the only premium that clarity can compress.
Institutional capital arrives on-chain at scale, and earnings growth runs at 55% instead of 40%. The three levers all land at their upper marks: the perp market compounds at 30% rather than 20%, DEX share reaches 35% of total perp trading volume (DEX and CEX) or above rather than 30%, and Hyperliquid takes 60% of DEX volume rather than 50%.
None of these is a new mechanism. They are the same forces already observed, running hotter because regulated access widens the funnel.
HIP-3 becomes a diversified business. Graduation from growth mode reaches 95% of volume at standard rates against 75% in the base, RWA perps establish onchain as the primary venue for 24/7 equity, commodity, and index trading, and three to five independent builders each carry over $100 million in open interest.
That last point matters doubly: it lifts HIP-3 earnings and it removes the trade.xyz concentration discount from the moat.
The team issues nothing dilutive. Future emissions inclusion drops from 10% to zero, because assuming the team alignment of interest of the team assumption holds, there is no rational reason to deploy authorized tokens, and supply turns deflationary.
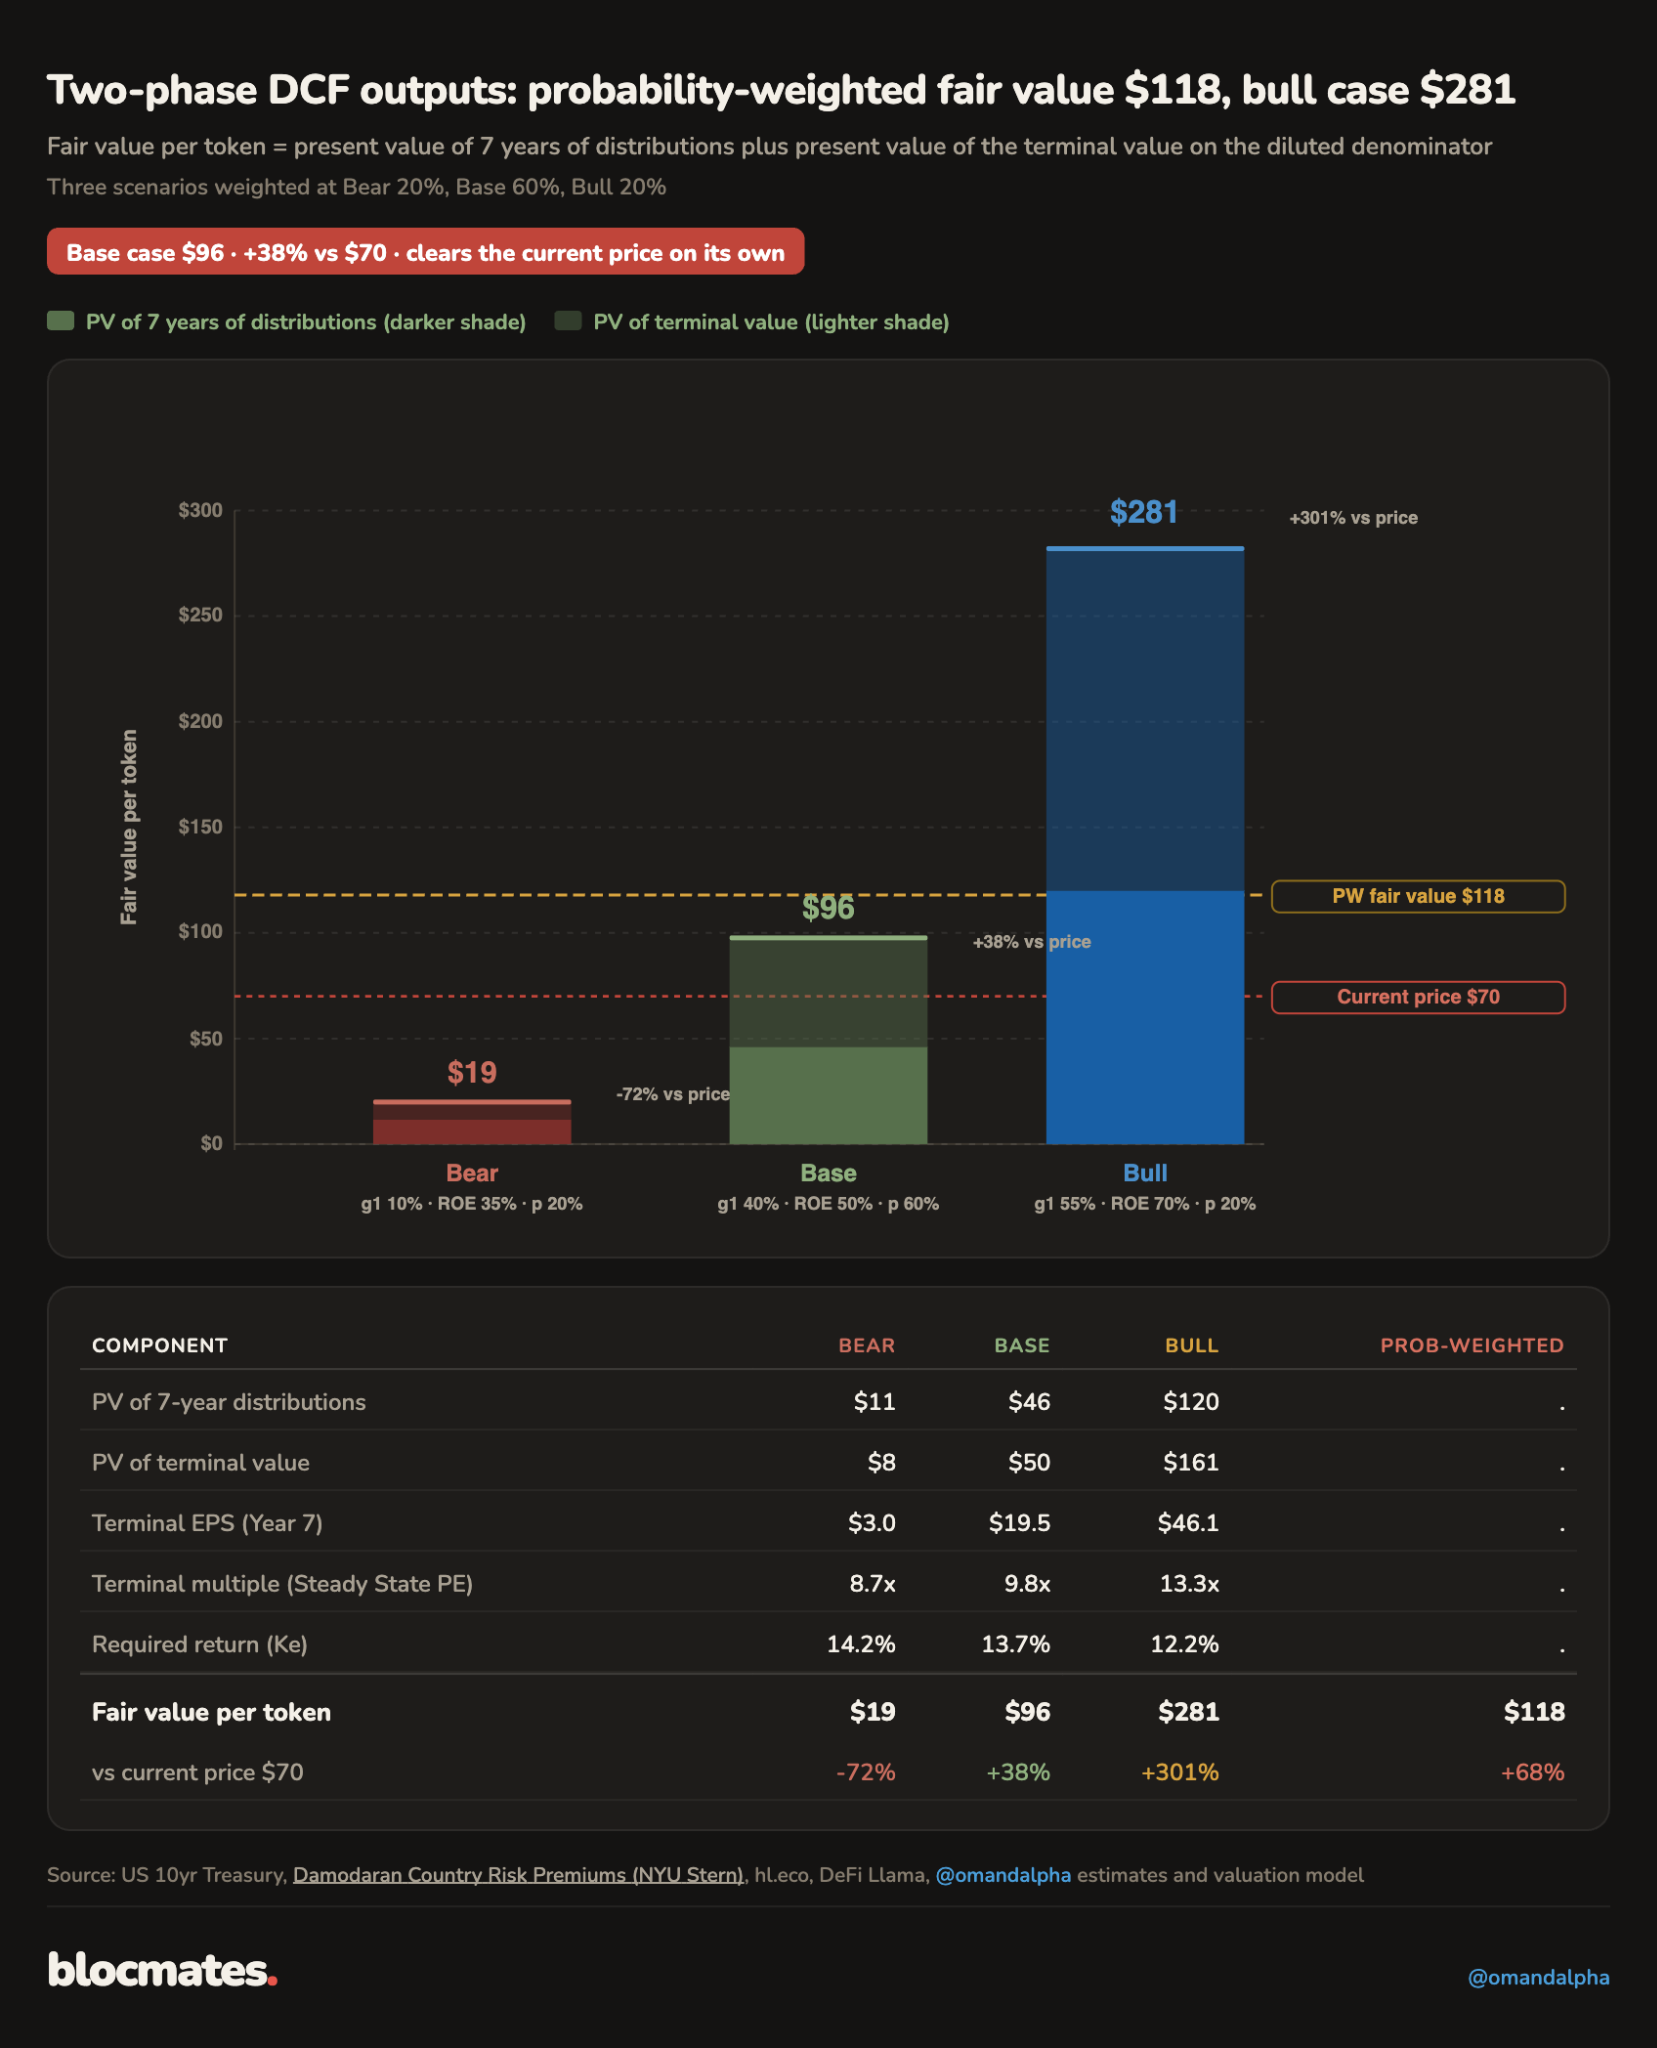
Several compounding factors make the bull case $281 rather than $150: faster earnings growth raises the numerator, the stronger moat lifts stabilized ROE from 50% to 70%, and the lower required return expands the terminal multiple from 9.8x to 13.3x.
In order to move from the base case to the bear case, four things need to break.
Competition erodes the moat: A well-capitalized entrant breaks the execution-quality moat (see, for example, Lighter’s aggressive promotional campaigns end 2025). Hyperliquid's share of total DEX trading volume halves from 40% to 20%, while DEX share of the total market (DEX and CEX perps together) stalls near 10%.
Growth stalls to 10%: The market compounds more slowly, the migration on-chain pauses, and earnings grow at barely above CME's mature rate (6-8%).
HIP-3 never graduates: Trade.xyz stays in growth mode to defend volume, no second builder shows up, and the largest forward earnings catalyst in the model quietly expires. The confirmer is auction prices collapsing toward the 500 HYPE floor.
The team’s capital discipline fails, and dilution picks up aggressively: Discipline fails under competitive pressure, and 60% of future emissions hit the market. Dilution is the one fight the bear case wins: supply reaches 603 million while earnings crawl.
The bear case essentially needs the moat to become ordinary. However, everything in this report argues it is not.
Breaking down the fair value components into the exponential phase and the terminal, steady state phase shows how important a correct understanding of the Steady State PE multiple is in valuation, which we will uncover in depth next.
Valuation sensitivity for different required returns and growth rates
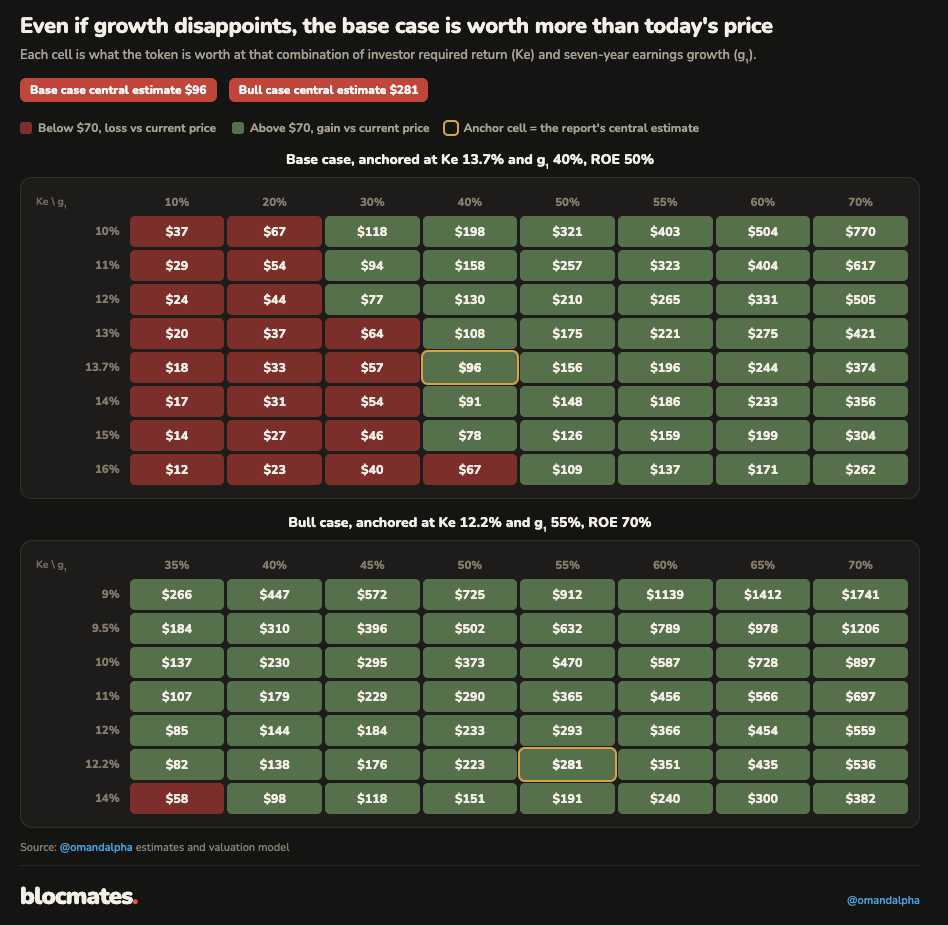
Investors may disagree with how we price risk or how we apply growth rates to HYPE’s earnings. The sensitivity analysis shows the fair values for different required returns and seven-year earnings growth rates (g1).
For example, in the base case, adding regulatory clarity while keeping all growth assumptions stable would improve our valuation to $130 from $96.
The bull grid barely contains a red cell. Once regulatory clarity lands and institutional flows arrive, the question is no longer whether $70 is cheap. It is how much upside the combination of growth and a lower required return unlocks, and the grid runs from $281 at the anchor to four figures in the corner.
At $70, the market is paying for a growth miss and a risk premium that never compresses. Every other cell is upside.
Valuation method 2: Steady state PE multiple and why it is different from using comparable multiples
Comparable PE multiples (PW and bull scenario upside of 120% and 290%)
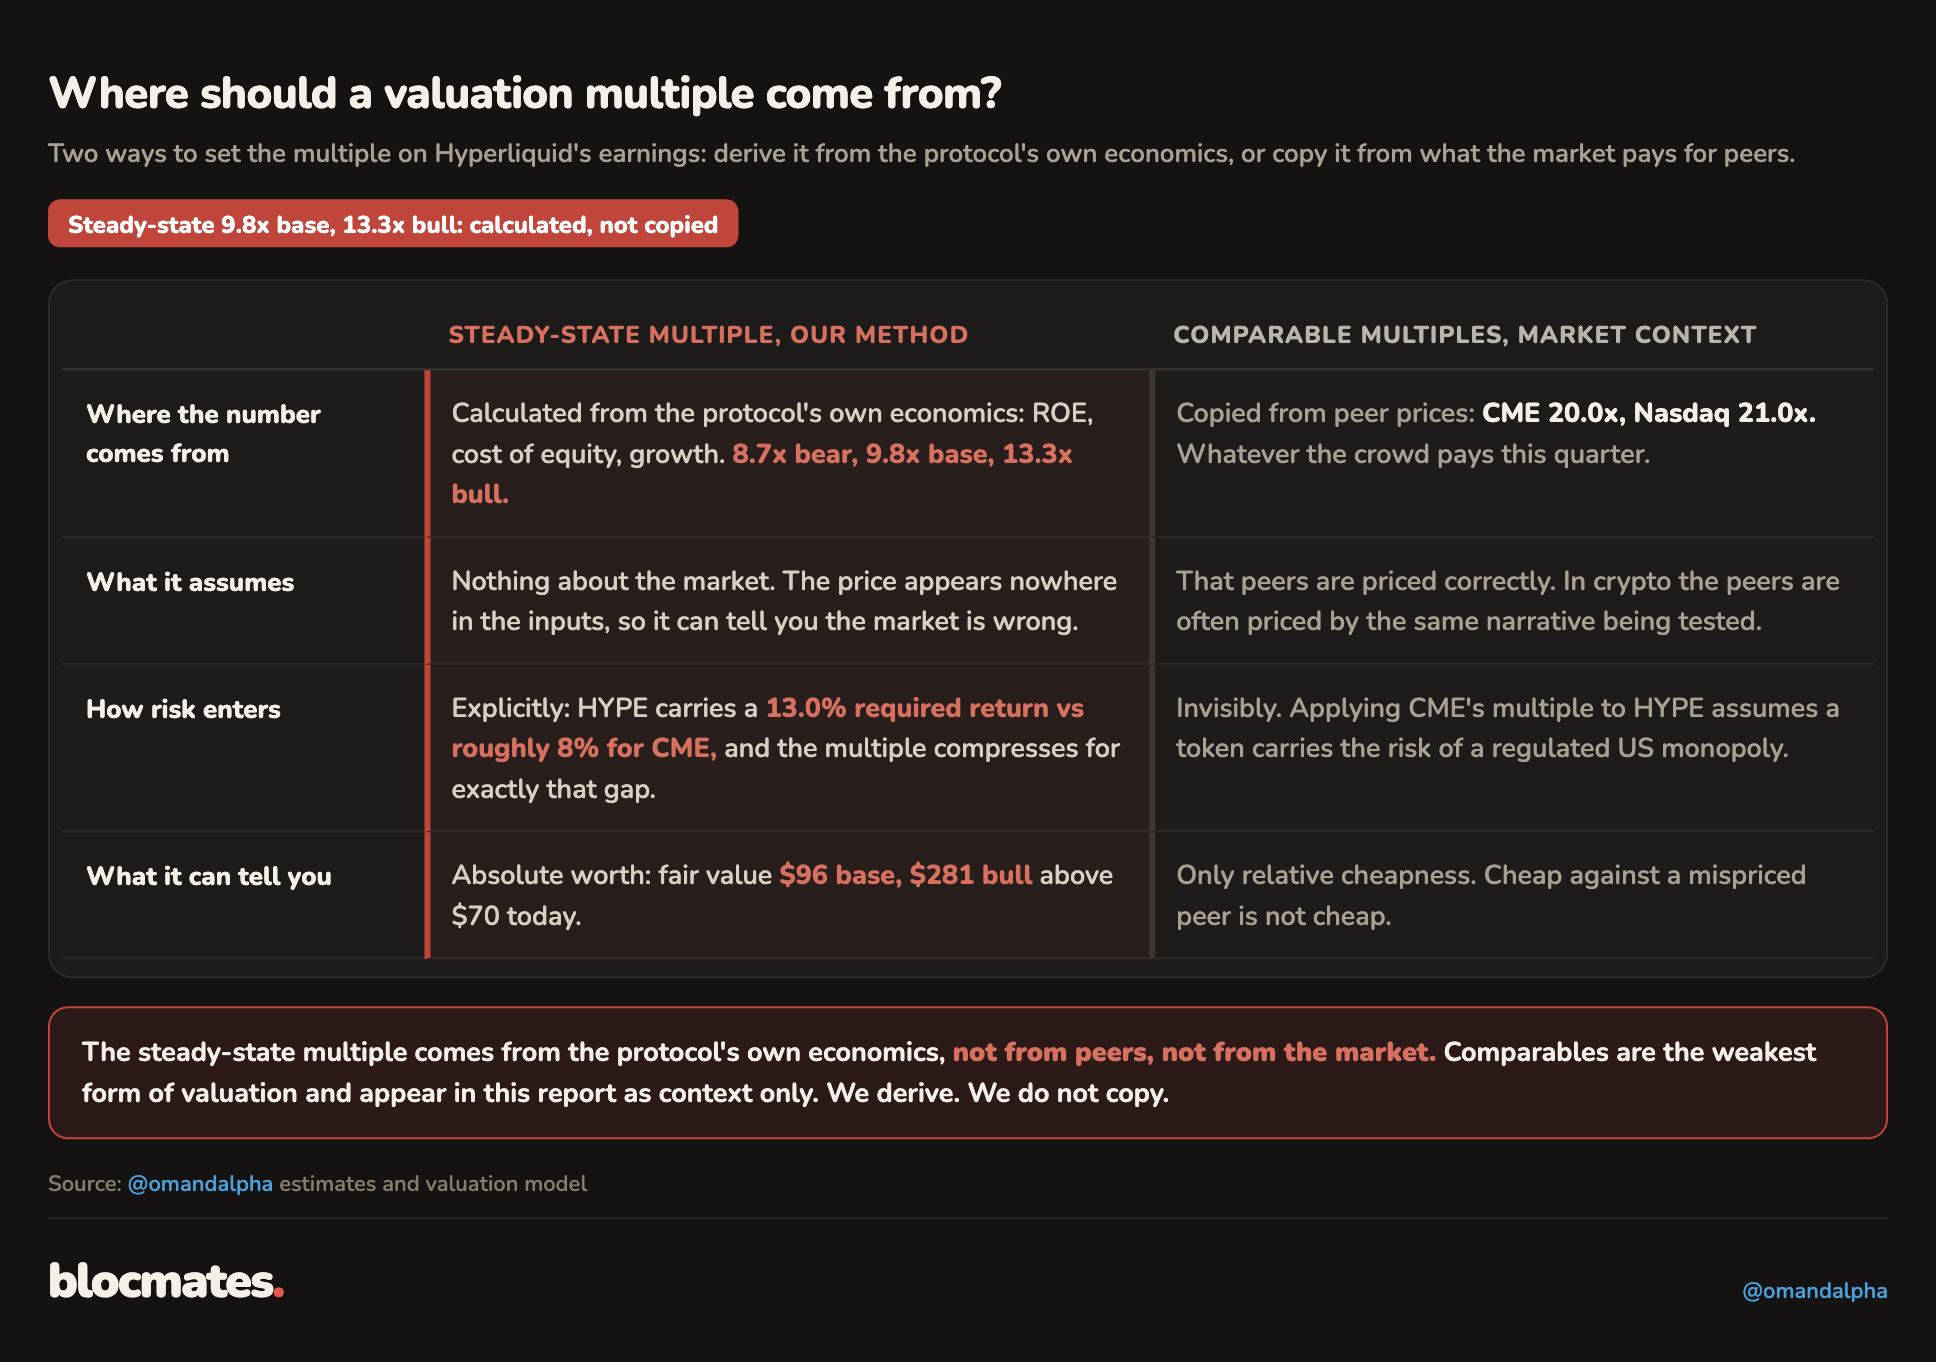
Time for a multiple deep dive. We have seen many valuations out there that apply an ‘implied valuation’ derived from TradFi trading averages, applying this to earnings forecasts of DeFi protocols.
If we were to apply this implied valuation of CME and Nasdaq on HYPE (we take Wall Street consensus forecasts for EPS of the TradFi comps, and the HYPE EPS comes from our model), the current HYPE price would have 120% upside in a PW scenario and 290% in a bull scenario.
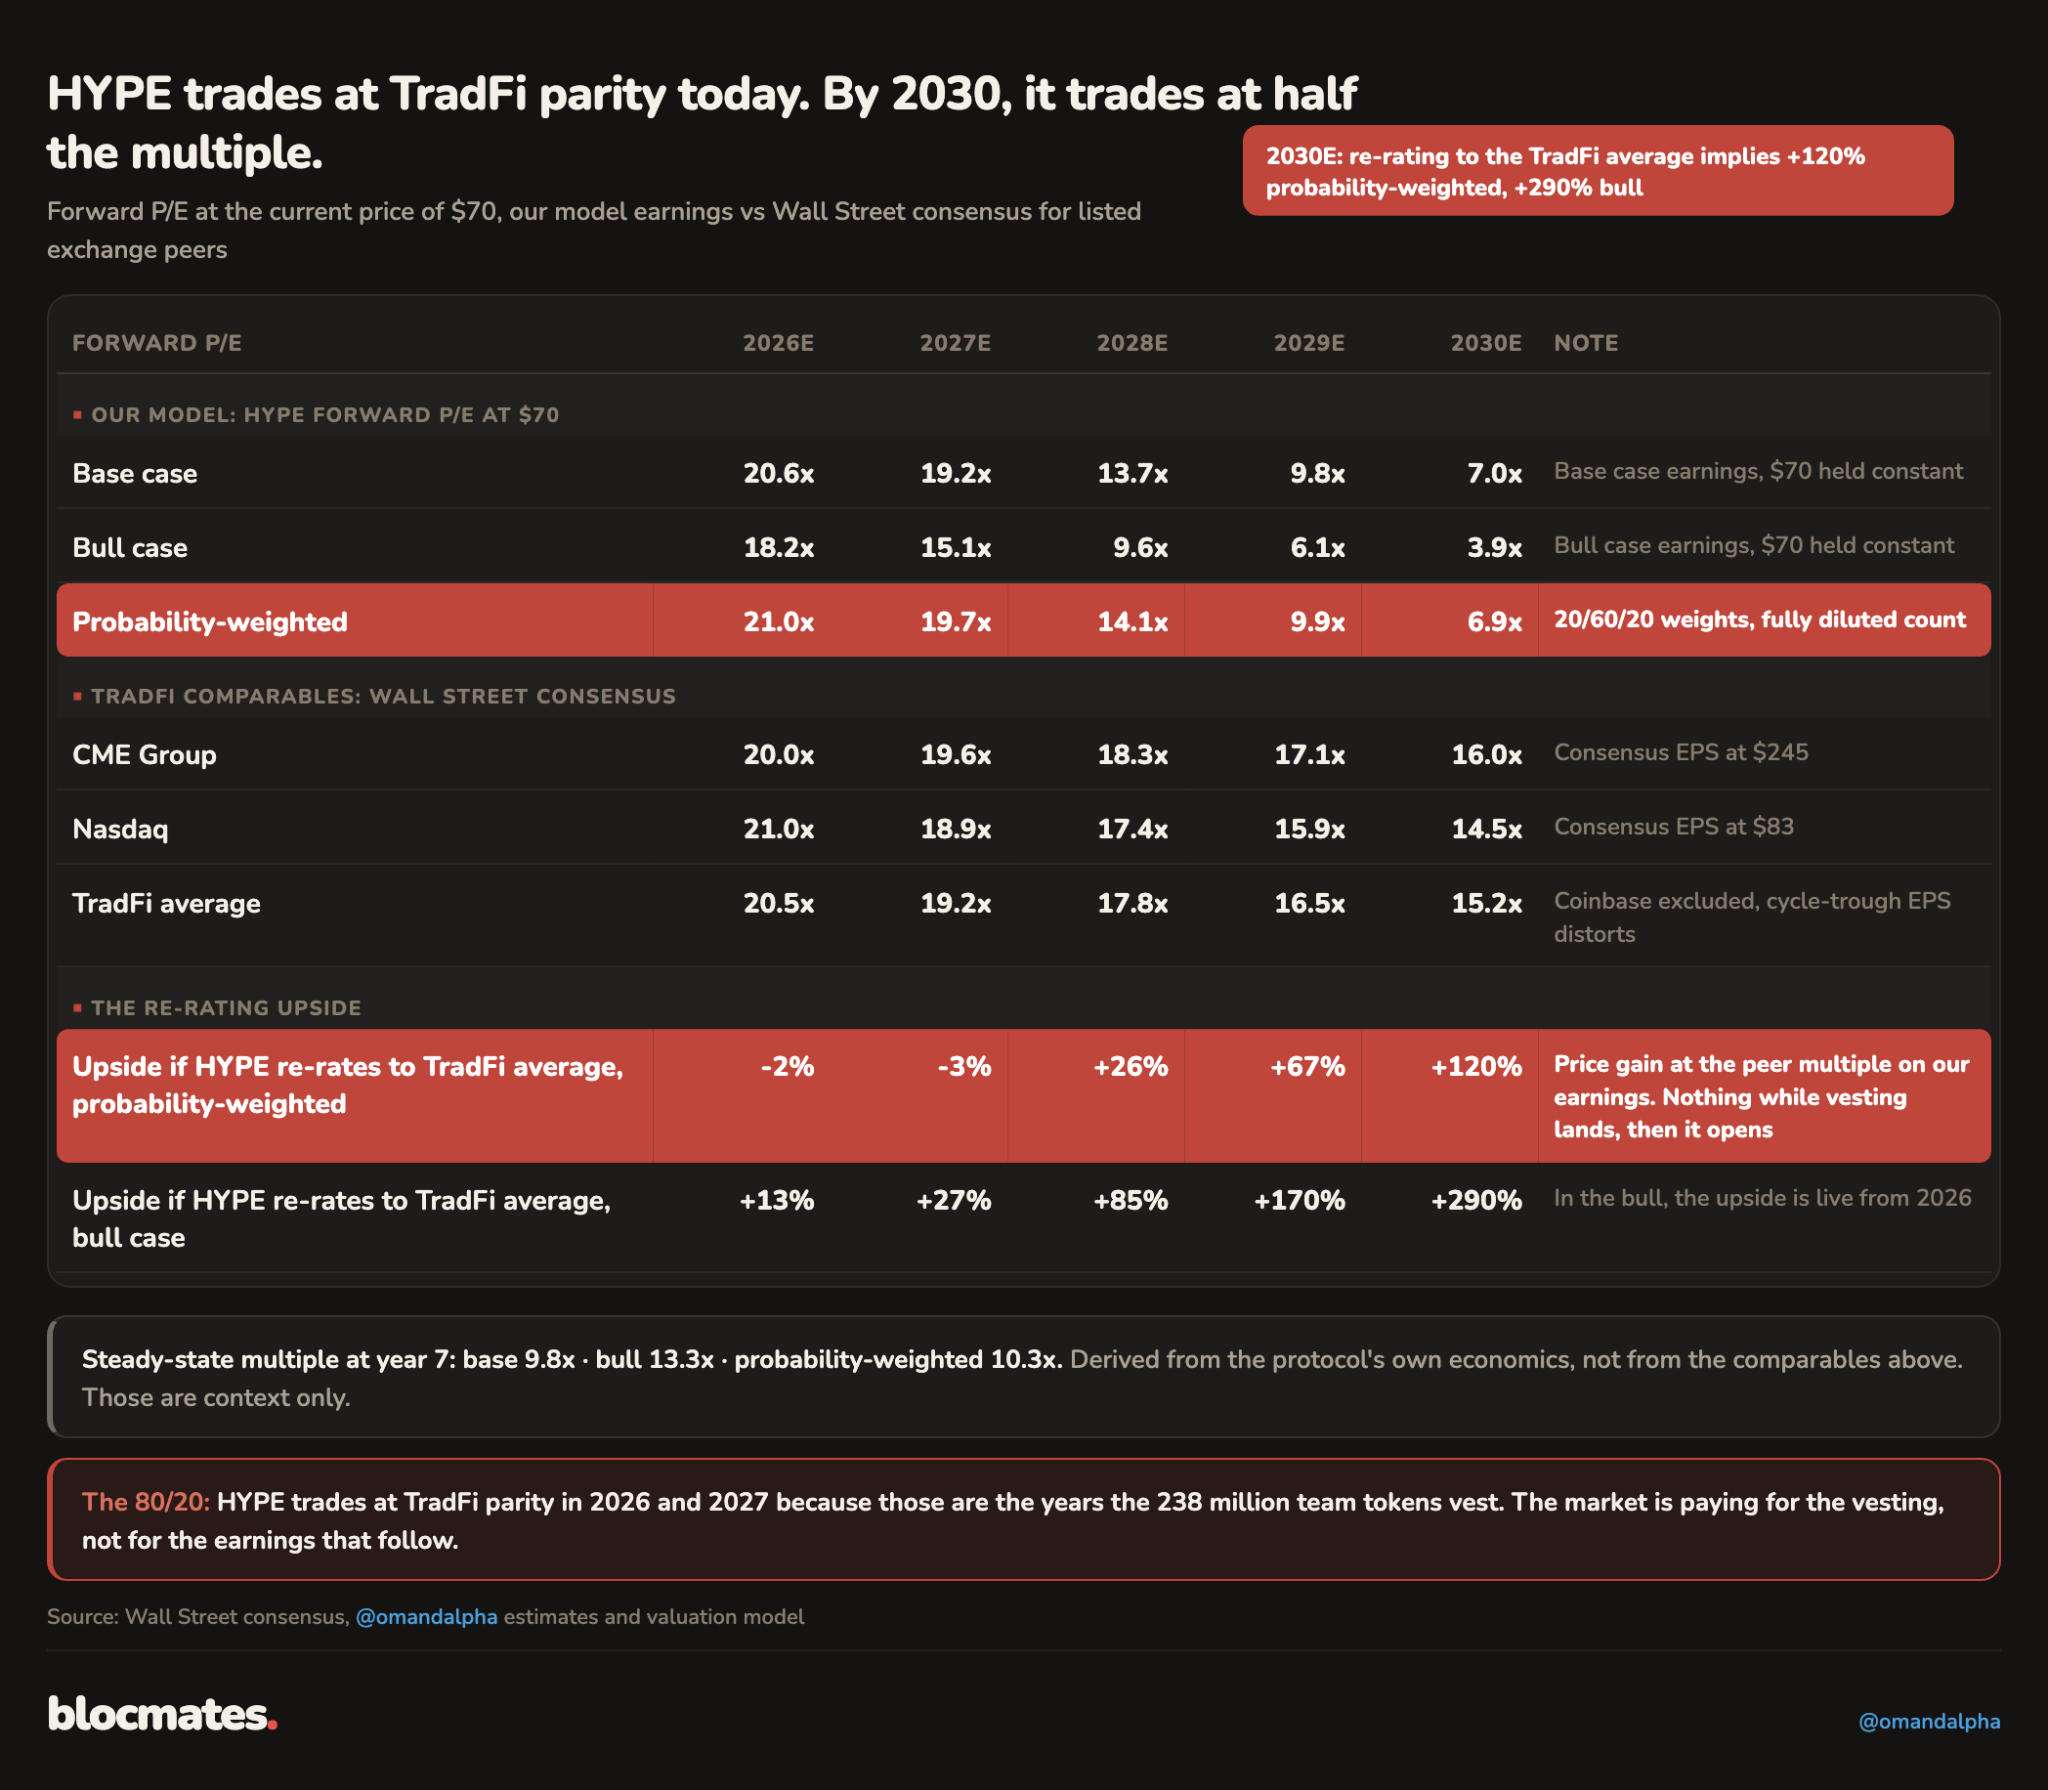
The visualization below shows exactly the same thing. We currently see the market prices HYPE in parity with TradFi on 2026F EPS, whereas the gap runs towards a hefty discount towards the terminal year. Valuation parity is maintained in the earlier years (due to core contributor token vestings), but picks up significantly after earnings growth aggressively overtakes the token dilution.
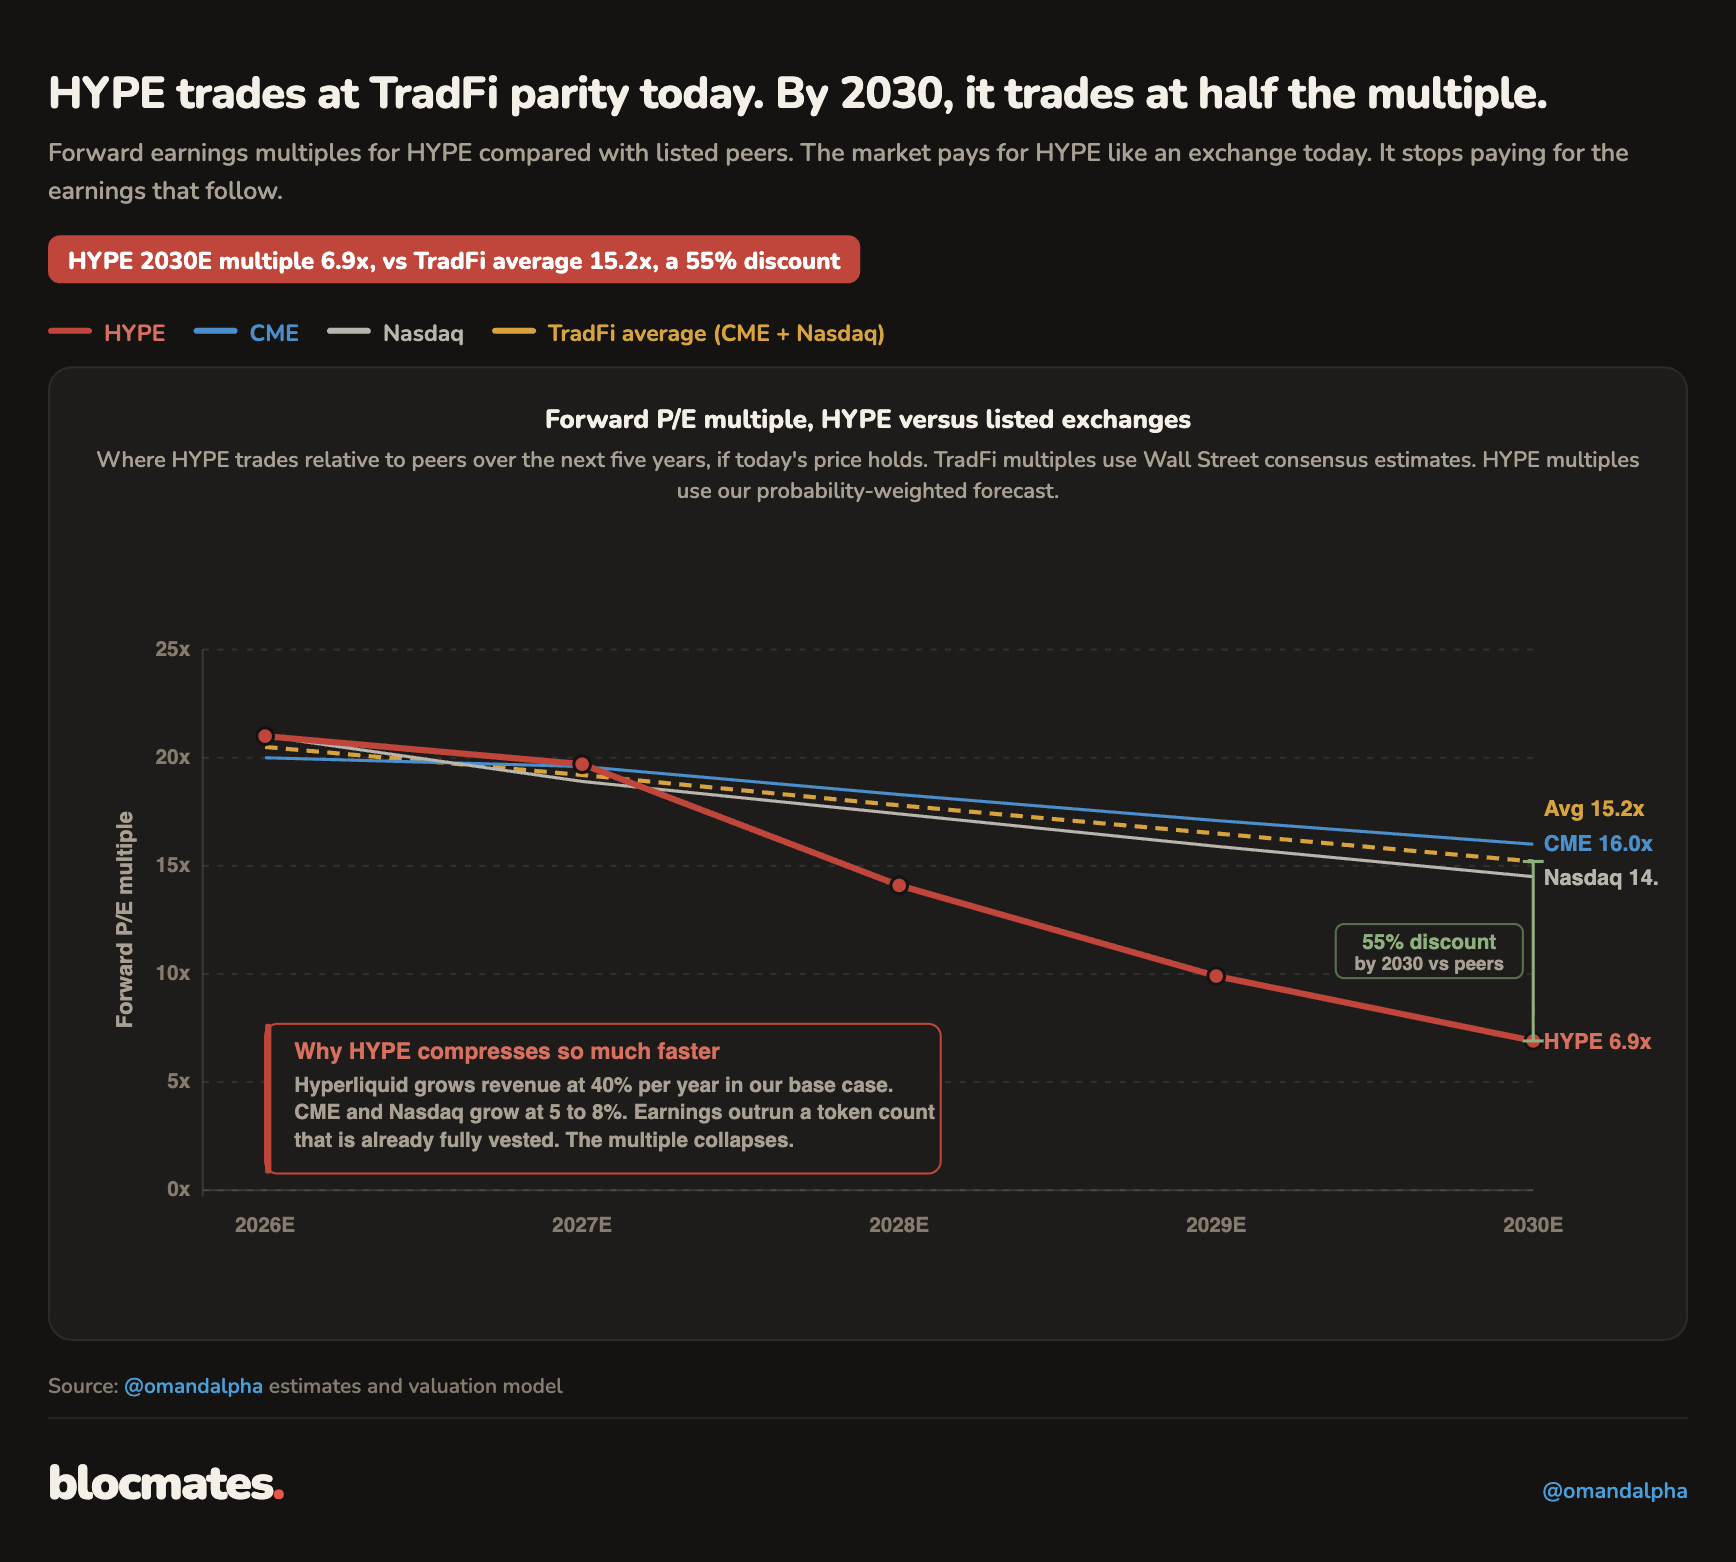
Many valuation analyses end here. We believe this form of valuation is sloppy, does not take into account risk (it assumes the risk profile of TradFi can be copied to DeFi, which is wrong), and it assumes comparables are priced correctly, which is circular.
The cost of equity section shows the calculation of the different required returns investors apply to the TradFi companies and HYPE, we pasted the conclusion again below.
All else being equal, investments that produce cash flows with a higher risk profile should be trading at a discount versus peers, not at parity. This is why we are not a fan of comparable multiples.
There is a different way to think about multiple valuations, though. The solution lies in calculating the PE multiple in a different way, not deriving from comparable business models, but by deriving a steady state PE multiple taking into account the growth profile, risk profile, and earnings growth profile from the project or company in question.
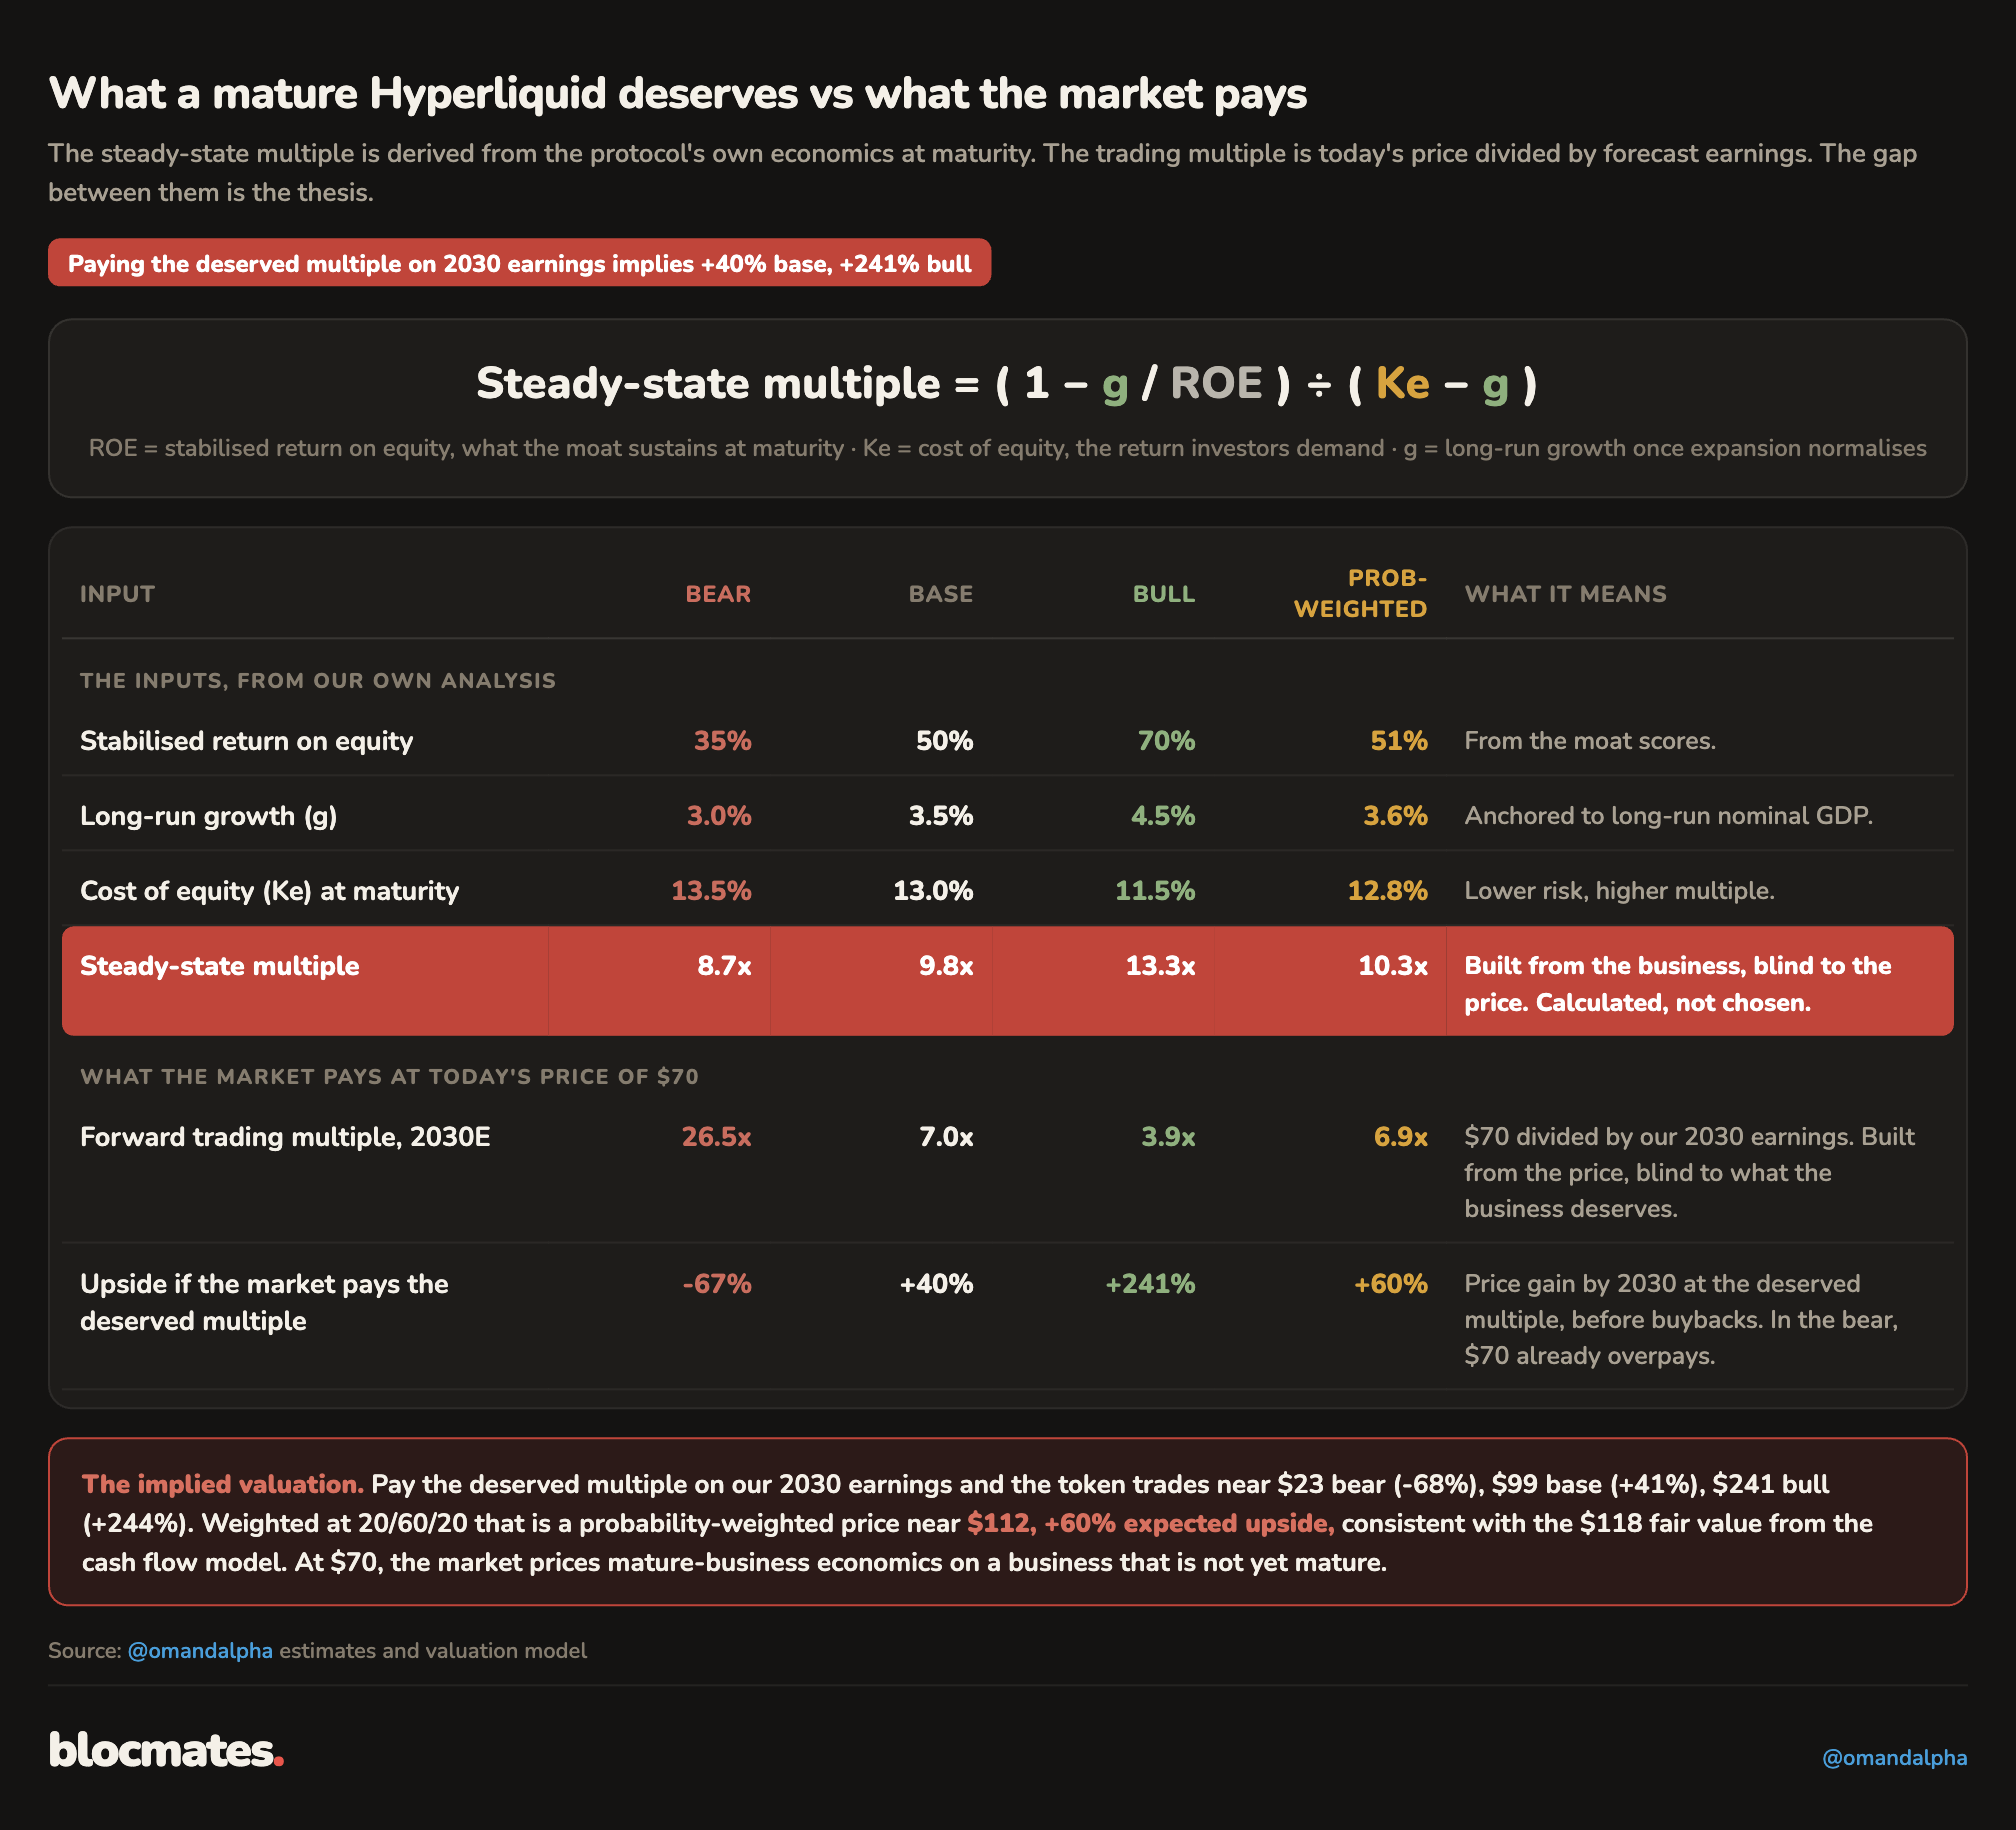
The correct way to apply multiples valuation: Steady State PE multiple (PW and bull scenario upside of 60% and 241%)
A steady state PE multiple is different from comparable multiples, as it reflects the business in a stabilized state, after exponential growth has materialized and after competition has driven ROE down to a sustainable ROE, hypergrowth has normalized, and the risk profile of the business has stabilized.
It is derived from first principles instead of borrowing one from the market.
It is a reworked version of the Dividend Discount Model, which, in some way, shape, or form, is used in most institutional valuations. A full derivation is described in the appendix.
The Steady State PE valuation is our preferred way to think about multiples valuation, and the key difference with comparables PE multiples is summarized below.
Inserting the work we have done on Cost of Equity (Ke), stabilized ROE (derived from the moat strength), and stabilized earnings growth, we calculate a PW PE multiple of 10.3x and a bull scenario PE of 13.3x.
Compared with the market's current earnings forecast, this implies a PW upside potential of 60% and a bull scenario upside of 241%.
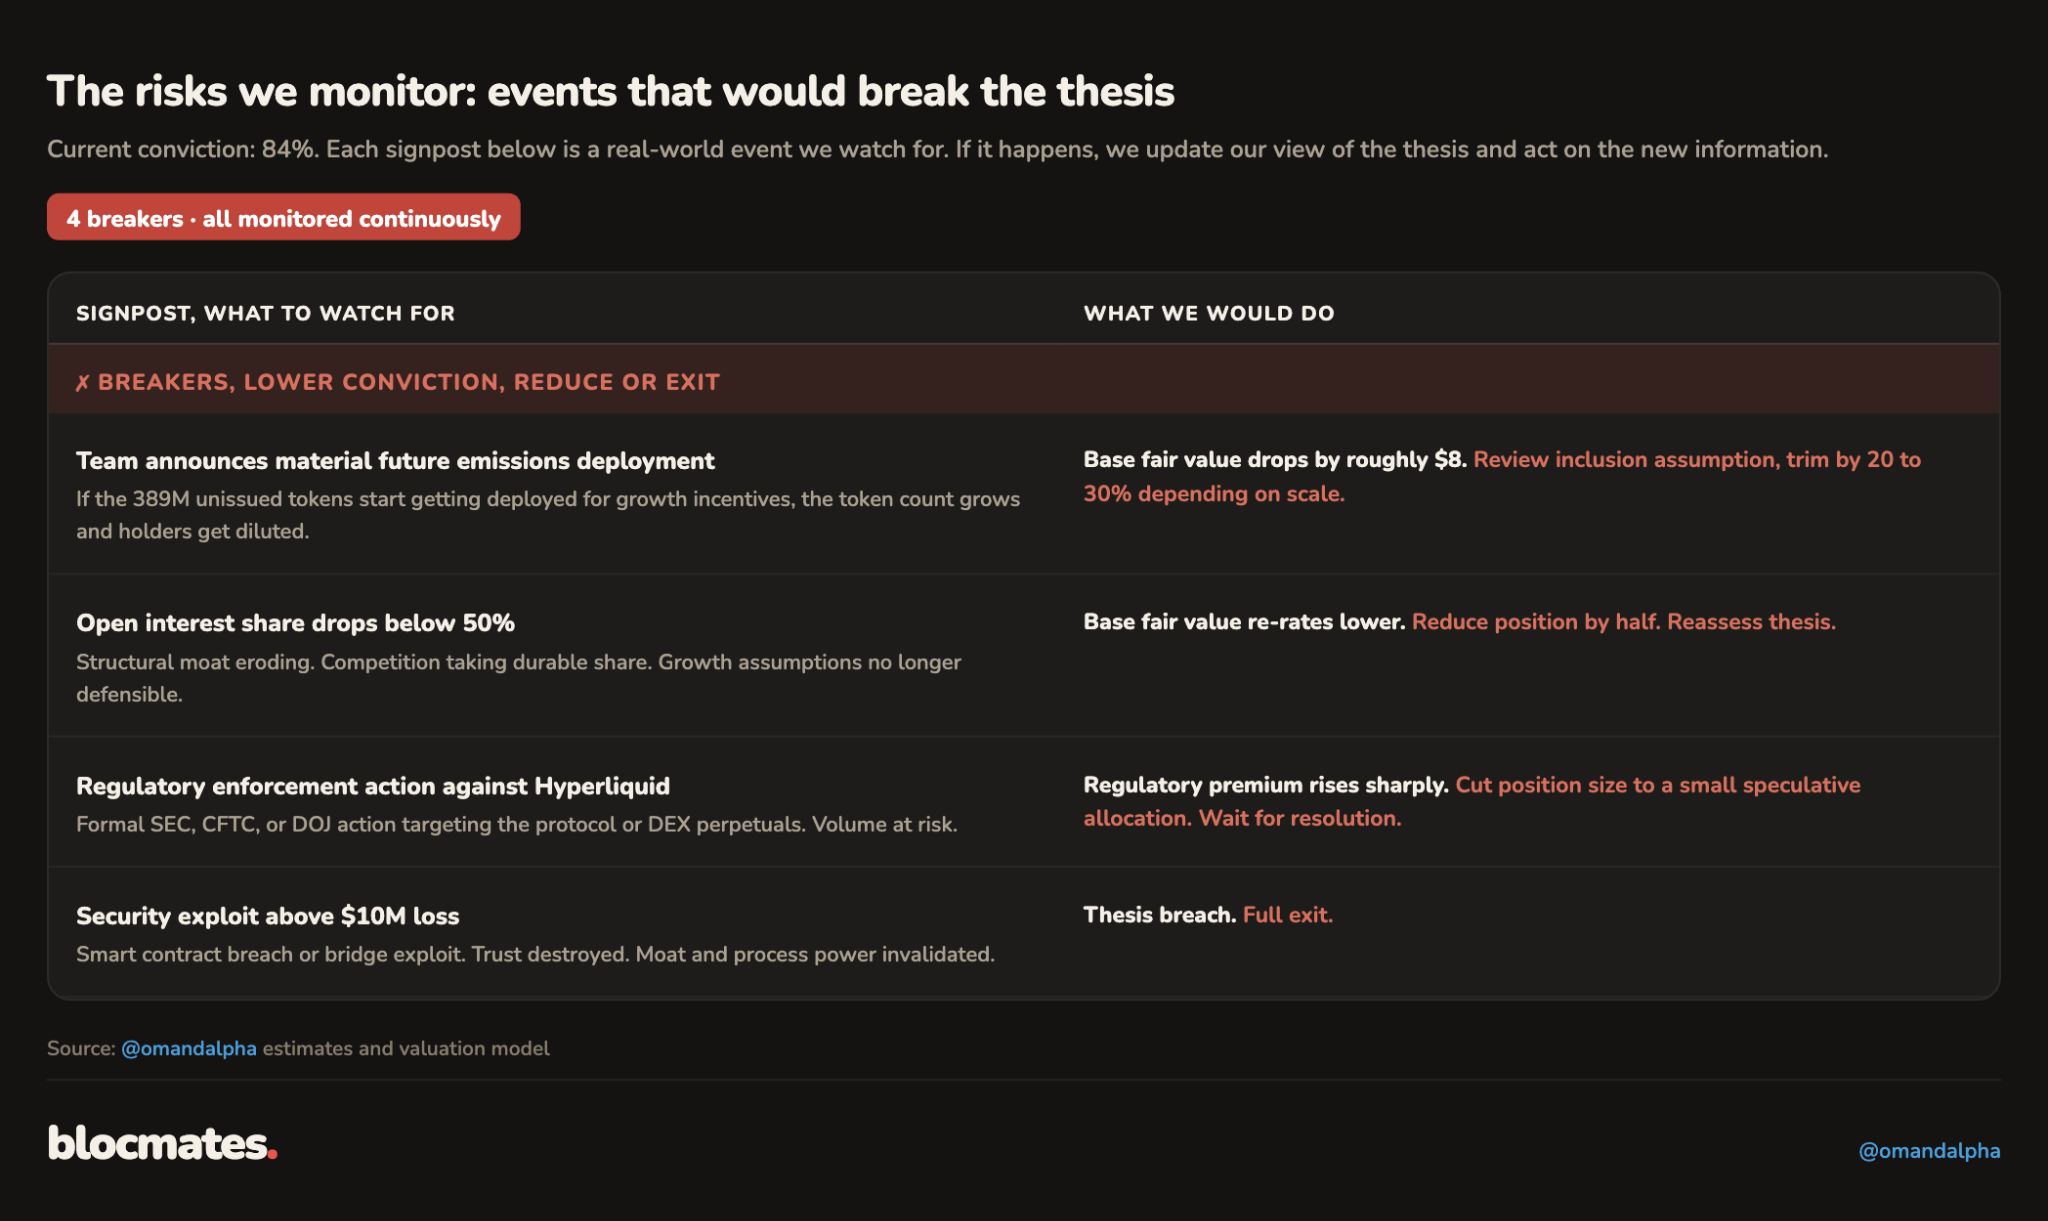
Risks that would make us change our minds
The biggest risks to the investment case are ranked by their impact on valuation.
Regulatory enforcement: A formal SEC, CFTC, or DOJ action naming Hyperliquid directly, or a USDC freeze on Hyperliquid-associated addresses.
This is the one event the thesis does not survive: the required return rises by a minimum of two percentage points, the bull case dies with institutional access, and conviction drops toward exit territory.
Builder concentration and earnings growth disappoint: Trade.xyz controls roughly 95% of HIP-3 open interest, so the largest forward earnings catalyst in the model sits with a single private counterparty.
We would cut our earnings growth significantly if trade.xyz open interest falls below $1.5 billion for two consecutive months. A drop in expected earnings CAGR from 40% base case to 30% would equal a drop in base case fair value from $96 to the $57 to $64 range, prompting a position reduction.
Moat erosion: The open interest share of DEX perps falls sharply below 50%, or core volume leaves for a competitor’s incentive campaign and does not return.
We would review our earnings growth forecast, cut our stabilized ROE estimates and moat scores, and increase the probability of a bear case in the PW valuation.
The team issues tokens in a non-accretive way: Despite the strong alignment of interest, the team announces deployment of the authorized token reserve without an accretive earnings case.
We would increase the dilutive token count in our valuation and cut valuations across the three scenarios.
Catalysts that would make us change our minds
The most important catalysts that would push up our valuation and positioning are ranked according to impact and importance.
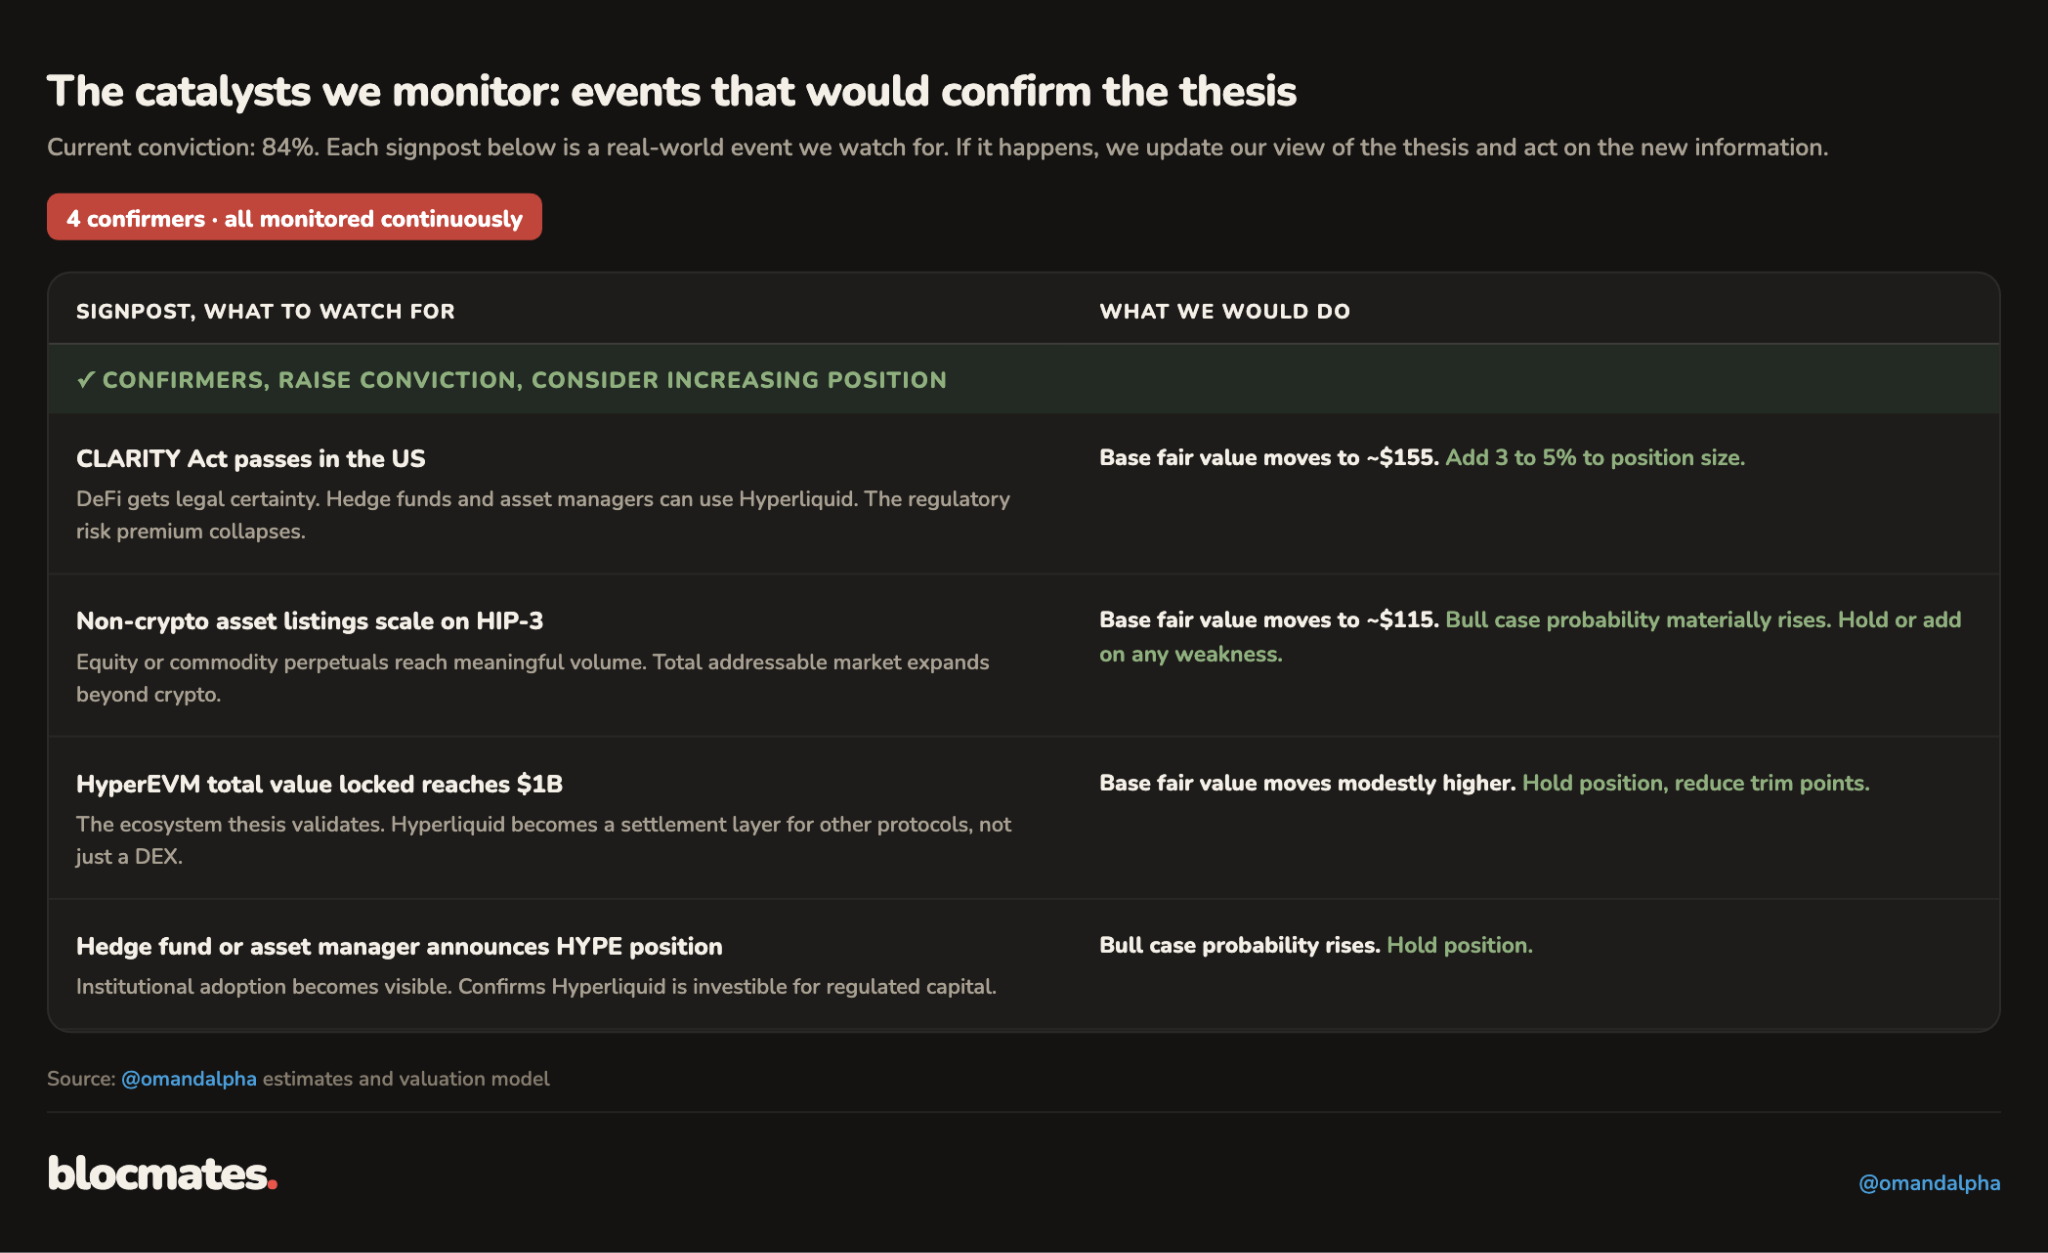
The Clarity Act passes: The single largest re-rating event in the model. The regulatory premium collapses, the required return falls from 13.7% toward 12.2%, and the base fair value moves from $96 toward roughly $155. We would increase the weight of the bull case in our PW valuation.
HIP-3 graduation at scale: The first major trade.xyz markets moving to standard rates lifts the effective take rate toward 7x current levels on the affected volume, and if HIP-3 reaches 35 to 40% of protocol revenue, the moat re-scores and stabilized ROE estimates, and the terminal valuation multiple would expand, improving the valuation. It pays attention to monitor the biggest, most liquid perp markets for trade.xyz.
Non-crypto listings scale on HIP-3: Equity and commodity perps reaching sustained volume expands the addressable market beyond crypto entirely, and it is already happening: seven of the top ten markets by volume are now tokenized traditional assets.
Builder diversification: Two to three independent builders, each above $100 million in open interest, convert the HIP-3 moat from a single-counterparty bet into a platform, and remove the largest risk discount in the thesis. We would rerate some weight in the PW valuation away from the bear case in favor of the base and bull case.
Conclusion
We believe investors should stop borrowing multiples and start deriving them.
The standard playbook in crypto valuation is to point at CME or Nasdaq trading at 20x, apply that multiple to a protocol's earnings forecast, and call the result a price target.
That method fails because it assumes the risk of a regulated US monopoly can be copied onto an unregulated protocol, and it assumes the peer is priced correctly, which is circular.
A multiple is not a number you look up. It is a number you build from three inputs: the return the business earns on its capital, the growth it can sustain, and the return you demand for holding it. The steady state PE formula does exactly that, and it prices the moat instead of assuming it.
The second discipline is risk-adjusting the cash flows before valuing them. Two protocols with identical earnings are not worth the same if one carries enforcement exposure, concentrated governance, and unaudited code while the other does not.
The cost of equity build-up quantifies that difference layer by layer, and it is the dominant lever in any high-growth valuation. Most of the analytical effort in this asset class goes into forecasting growth. Most of the value lies in pricing risk.
The third is dilution honesty. Count every token that vests, claimed or not, the same convention equity markets apply to diluted shares. A valuation built on circulating supply flatters every multiple it touches, and the flattery unwinds exactly when the tokens land.
None of this is new finance. It is the discipline institutional capital has applied to equities for decades, adapted to protocol economics. Institutional capital is coming onchain, it will bring these frameworks with it, and the assets that look cheap through this lens before that capital arrives are where the repricing is most likely.
Adopting the framework now is how an investor gets ahead of the herd rather than trading behind it.
Applied to Hyperliquid, the framework produces a specific answer. At $70, the market pays for 34% growth and a risk premium that never compresses. We underwrite 40% growth and see a named, dated path to compression in the Clarity Act.
Three independent methods put a fair value between $112 and $118, probability-weighted, with $281 in the bull.
What should the reader do?
- If you hold HYPE, this report gives you the levers your position actually depends on. Watch the regulatory premium, watch trade.xyz open interest, watch DEX share of total perp trading volume, and act on the signposts rather than the price.
- If you do not hold it, the framework is the takeaway: six steps, three methods, one probability-weighted number, applicable to any protocol with real cash flows. Run your current portfolio through it and see which positions survive a 13.7% hurdle rate.
- Test your own assumptions by inserting them in our interactive valuation model here.
Appendix: derivation of the terminal valuation multiple (Steady State PE multiple)
Where a multiple actually comes from:
Most crypto valuations borrow their multiple. Someone points at a peer trading at 30x earnings and says this one should trade there too.
We believe this is overly simplistic, ignores risk, and ignores critical thinking on the cost of capital, and what the moat and business are worth after competition drove down ROE towards a sustainable level.
What is a token actually worth?
A token is worth the cash it hands back to you over its life, discounted for time and risk. That is the whole of valuation in one line. Write it as a growing stream: you collect a dividend (in HYPE’s case, this is a token burn, which has the same economic value as a dividend), it grows at rate g every year, and you discount it at Ke, the return you demand for taking the risk.
Price = EPS / (Ke - g)
Learn more about the dividend discount formula here
EPS is the earnings per token. Ke is the cost of equity, your hurdle rate. g is the rate at which those earnings grow, forever.
Turn the price into a multiple
Divide both sides by earnings, and the multiple falls straight out.
P/E = payout / (Ke - g)
Payout is the slice of EPS actually returned to holders. For Hyperliquid, that slice is the buyback, funded by close to 100% of fees. The multiple now rests on three things: how much gets paid out, the hurdle Ke, and growth g.
Growth is not free, and that is where ROE walks in
A business only grows by reinvesting earnings, and reinvested capital earns a return, its return on equity. Growth has to be bought:
g = (share reinvested) × ROE
Flip it around, and the share you must reinvest is g / ROE. Whatever is left over is the payout, 1 - g / ROE. Drop that into the multiple, and nothing is borrowed from a peer anymore:
P/E = (1 - g / ROE) / (Ke - g)
ROE is the engine, and the Moat Score decides if it survives
A high ROE means the business earns a lot on every dollar it keeps. It can fund its own growth cheaply and still return most of the earnings, which means a high payout and a high multiple. A low ROE means growth eats the earnings, the payout shrinks, and the multiple falls with it.
The real question is whether that high ROE lasts. Profit attracts competition, and competition drags returns down toward the hurdle. ROE only stays high if something structural stops the copying, and that something is the moat.
This is why we score the moat before we touch the multiple. Helmer's powers and Porter's forces produce a Moat Score, and that score is the entire justification for holding ROE above Ke. No verified moat, no premium multiple, no matter how good the story sounds.
The test that makes it click: no moat means P/E = 1 / Ke
Take the extreme case. A business with no moat sees competition drag its ROE all the way down to Ke. Set ROE equal to Ke in the formula, and the growth term cancels out completely:
P/E = 1 / Ke
A business with no moat is worth 1 / Ke whatever its growth rate, because it is forced to reinvest at a return equal to its cost of capital and creates nothing on the way. Growth without a moat is motion dressed up as value. At Hyperliquid's terminal Ke of 13.0%, that no-moat floor sits at roughly 7.7x.
Hyperliquid, base case, in three numbers:
Now the base terminal multiple, straight from the model. The terminal cost of equity, Ke, is 13.0%, the hurdle at maturity once the smart-contract risk premium has decayed to its floor.
Terminal growth, g, is 3.5%, pinned to long-run nominal GDP, because nothing outgrows the economy forever. Stabilized ROE is 50%, what a moat-protected Hyperliquid earns on the capital it keeps.
Payout first: 1 - g / ROE = 1 - 3.5 / 50 = 93%. It retains just 7% of earnings to fund 3.5% growth because a 50% ROE makes that growth cheap to buy.
Then the multiple: 93% / (13.0% - 3.5%) = 9.8x.
That 9.8x sits two full turns above the 7.7x no-moat floor for one reason: a 50% ROE earning far above a 13.0% hurdle. Those extra turns are not a market opinion; they are the moat, priced.












.webp)

.webp)

.webp)

.png)



.webp)



.webp)
.webp)

.webp)
.webp)

















.webp)

.webp)


.webp)






.webp)
.webp)





.webp)

.webp)
























.webp)
.webp)

.webp)
.webp)
.webp)


.webp)
.webp)


.webp)


.webp)




.webp)


.webp)



.webp)






















.webp)







.webp)















.webp)

.webp)
.webp)

.webp)














.webp)

.webp)


.webp)





.webp)