
Bitcoin has thrown the market a curveball after printing a death cross, a chart pattern that many traders weren’t expecting to see this late in the cycle.
The pattern arrived just as sentiment was leaning bullish after BTC registered an all-time high last month. The death cross pattern has also sparked a fresh round of debate about whether BTC is entering a deeper pullback or simply resetting before its next leg.
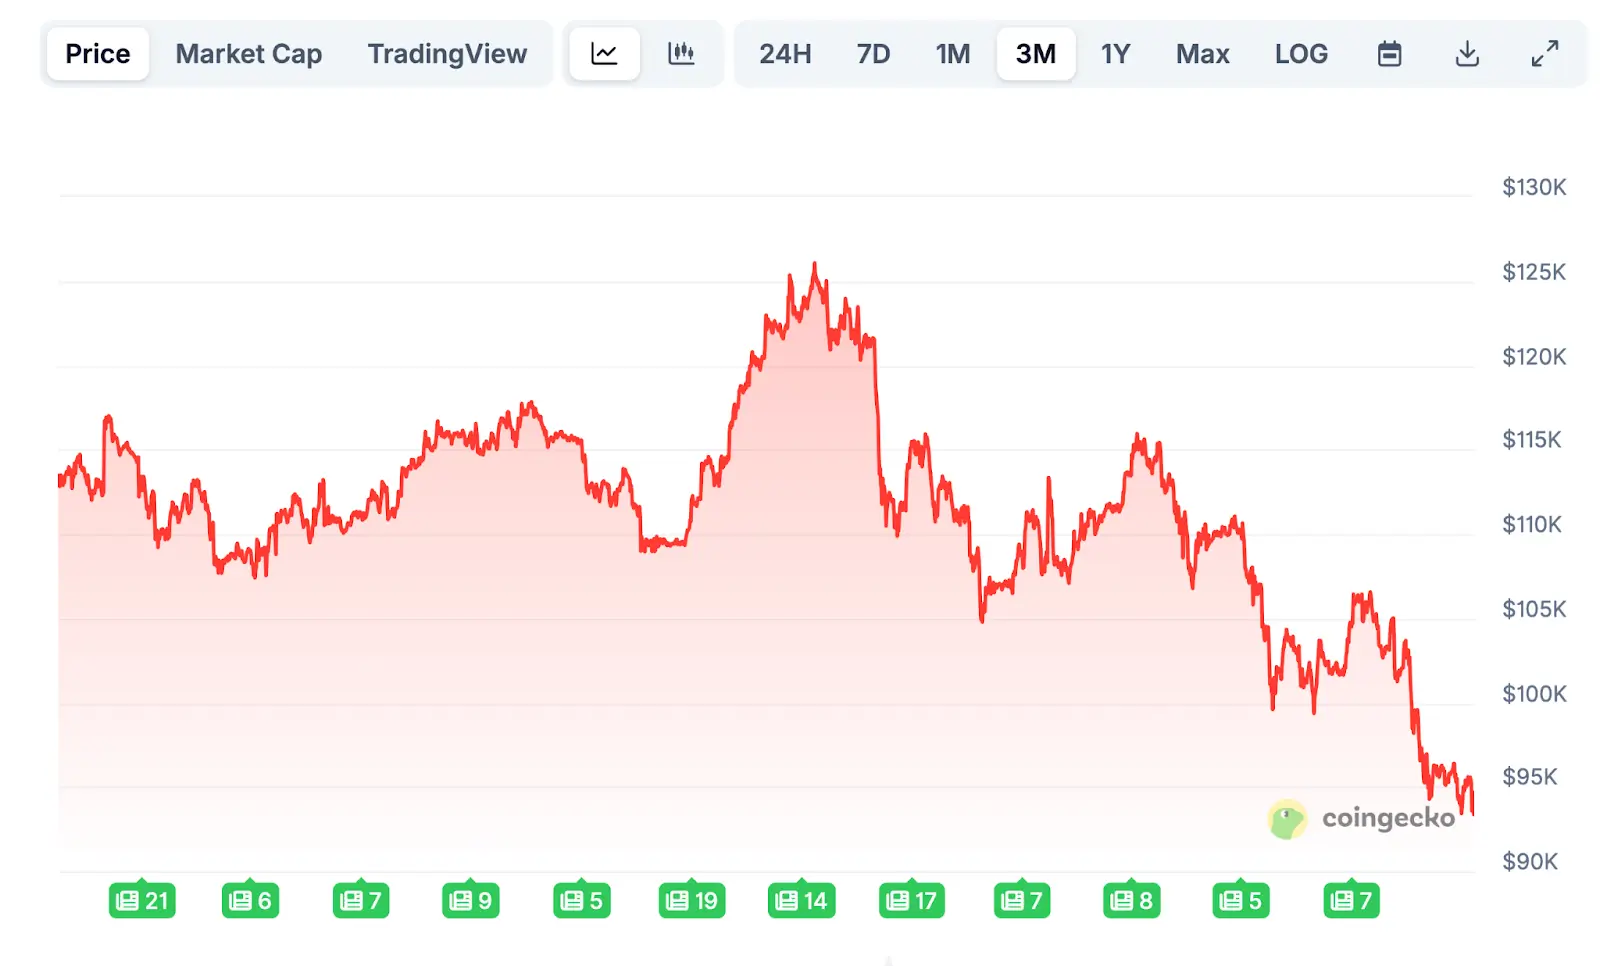
At the time of writing, Bitcoin is trading around $93,326, down 11% on the week and roughly 26% below its early-October all-time high of $126,000.
What the death cross means and why it matters
A death cross occurs when the 50-day moving average dips below the 200-day moving average, signaling that short-term momentum has weakened relative to the longer trend.
It’s not a new concept, traders have been using it for decades, but Bitcoin’s history with the signal has been mixed. Sometimes it precedes long declines; other times it marks a local bottom and a reversal.
Analyst Benjamin Cowen highlighted this pattern in an X post, noting that previous BTC death crosses have often shown up near market lows. Still, he added that context matters: “If no bounce occurs within 1 week, probably another dump before a larger rally back to the 200D SMA.”
Another trader shared historical data showing that out of 11 death crosses since 2014, Bitcoin turned bearish six times one week after the signal.
Another analyst Atlas on X broke down the mechanics in a lengthy thread. He emphasized that while a death cross can indicate weakening momentum, it’s a lagging indicator, meaning much of the drawdown often happens before the crossover even appears.
Atlas also pointed to confirming signals like RSI, MACD, and volume, noting that high selling pressure after the cross typically validates a deeper downturn, while low volume can suggest a fakeout.
He added that Bitcoin’s reaction may depend heavily on broader conditions such as liquidity, macro sentiment, and ETF flows.
Analysts split on whether this Signals a top or a bottom
Not everyone sees the cross as a bearish omen. Analyst Batman described it as a “bottom cross,” pointing out that when measured with the 50-day and 200-day averages, similar signals marked major BTC bottoms in 2023, 2024, and earlier this year.
While he didn’t predict an immediate rally, he suggested that if past patterns hold, this could represent a local low before a recovery move.


.webp)

.webp)


.webp)


.webp)
.webp)


.webp)

.webp)


.webp)

.webp)
.webp)

%20(1).webp)


.webp)
.webp)

.webp)
.webp)
.webp)


.webp)
.webp)


.webp)


.webp)


.webp)


.webp)


.webp)


.webp)


.webp)


.webp)

.webp)
.webp)

.webp)


.webp)

.webp)


.webp)


.webp)